S&P 500 Weekly Technical Forecast
Here are the weekly technical forecast for S&P500 in US Stock Market.
Dec 07, 2012 - S&P 500 closed today at 1418.07 which is near flat compared to last week close of 1416.18 on Nov 30, 2012. S&P 500 was trading between 1398.23 and 1423.73 which is a narrow swing of about 26 points.
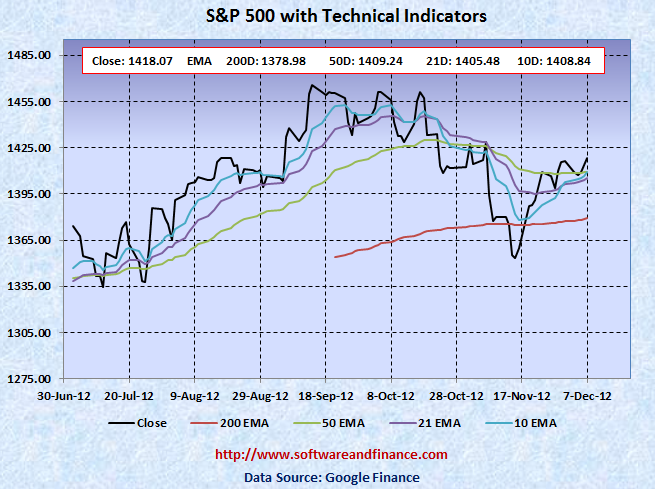
Nov 30, 2012 - S&P 500 closed today at 1416.18 which is about 7 points up compared to last week close of 1409.15 on Nov 23, 2012. S&P 500 was trading between 1385.43 and 1419.70 which is a swing of about 34 points.
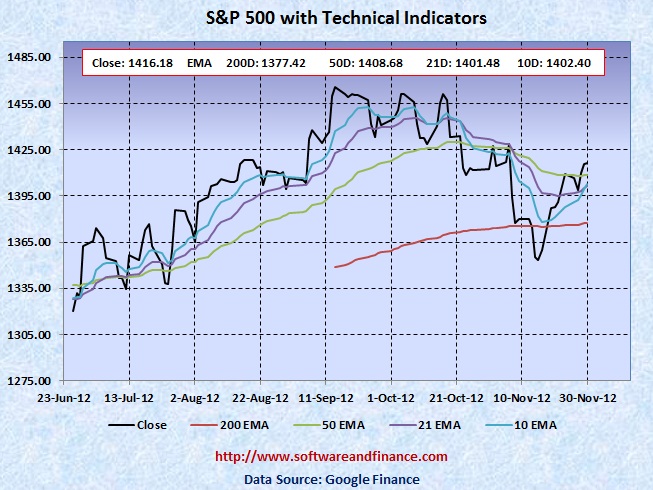
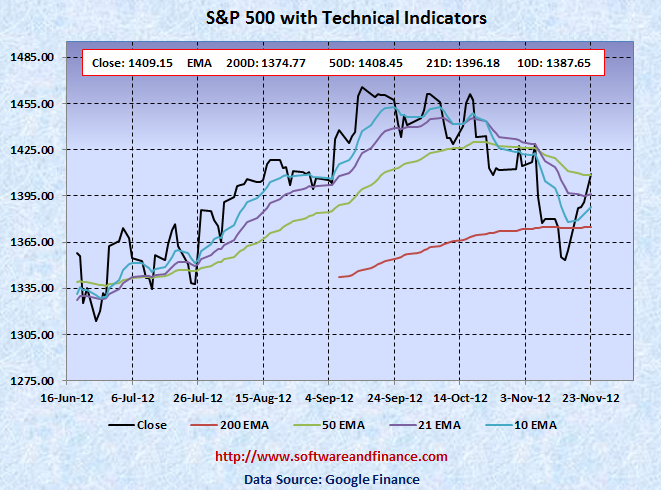
Nov 23, 2012 - S&P 500 closed today at 1409.15 which is about 49 points up compared to last week close of 1359.88 on Nov 16, 2012. S&P 500 was trading between 1359.88 and 1409.16 which is a swing of about 50 points.
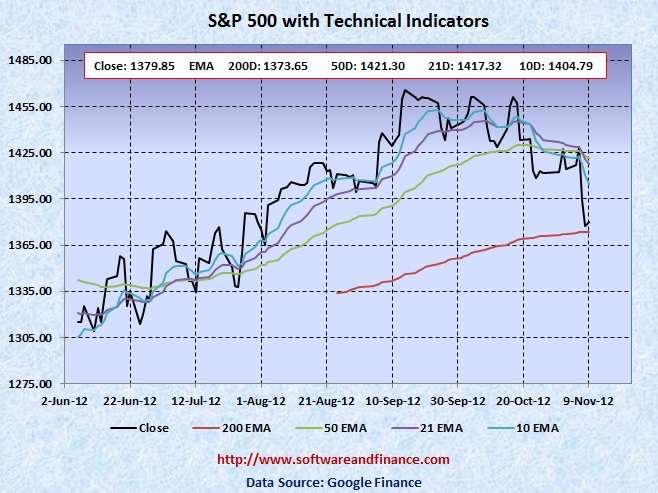
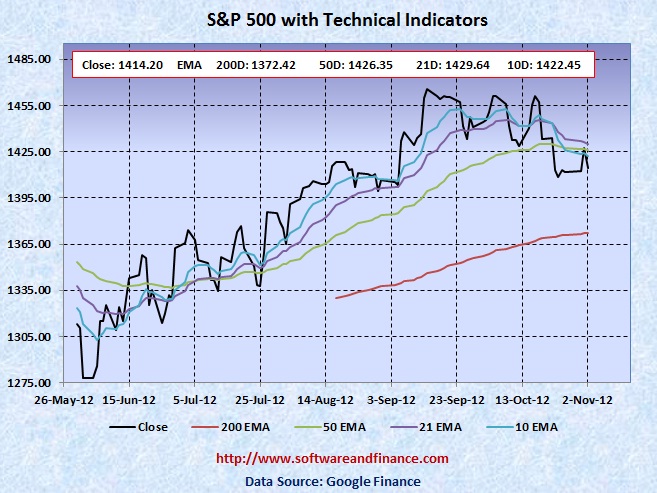
Nov 09, 2012 - S&P 500 closed today at 1379.85 which is about 34 points down compared to last week close of 1414.20 on Nov 02, 2012. S&P 500 was trading between 1373.03 and 1433.38 which is a swing of about 60 points.
Nov 02, 2012 - S&P 500 closed today at 1414.20 which is about 2.26 points up compared to last week close of 1411.94 on Oct 26, 2012. S&P 500 was trading between 1405.95 and 1434.27 which is a swing of about 28 points. US Stock exchanges are closed for two days (Oct 29 - 30, 2012) due to Hurricane Sandy. Hurricane Sandy is expected to cost between $15 - $40 billion dollars. The actual damage will come out in the coming weeks. New York and New Jersey are the two states that got hit heavily with Hurricane Sandy.
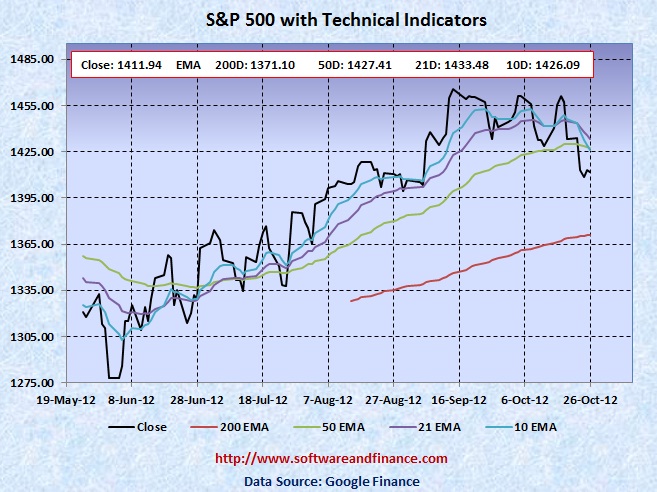
Oct 26, 2012 - S&P 500 closed today at 1411.94 which is about 21 points down compared to last week close of 1433.19 on Oct 19, 2012. S&P 500 was trading between 1403.28 and 1435.46 which is a swing of about 32 points.
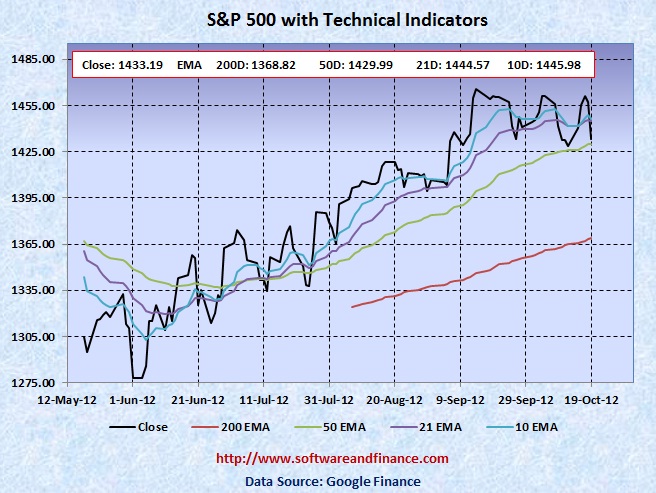
Oct 19, 2012 - S&P 500 closed today at 1433.19 which is about 4 points up compared to last week close of 1428.59 on Oct 12, 2012. S&P 500 was trading between 1427.24 and 1464.02 which is a swing of about 37 points.
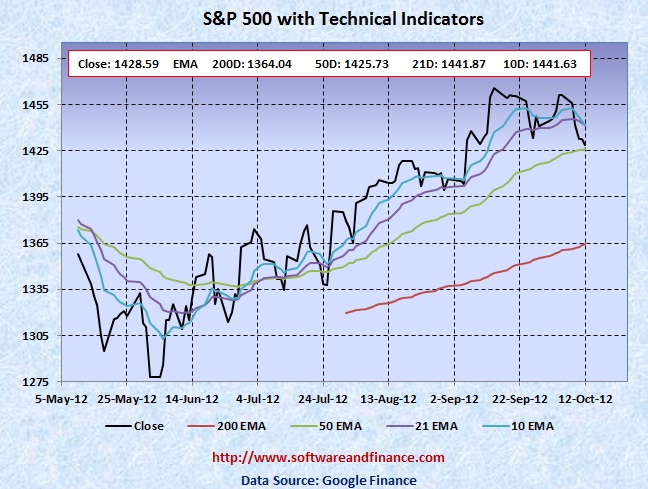
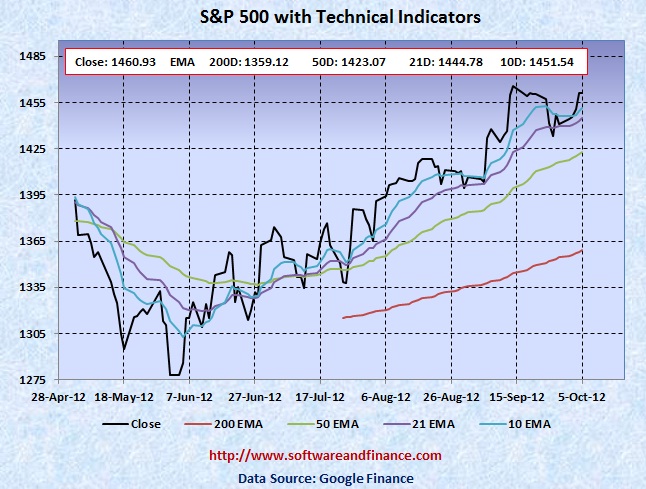
Oct 12, 2012 - S&P 500 closed today at 1428.59 which is about 32 points down compared to last week close of 1460.93 on Oct 05, 2012. S&P 500 was trading between 1425.53 and 1460.93 which is a swing of about 35 points.
Oct 05, 2012 - S&P 500 closed today at 1460.93 which near about 20 points up compared to last week close of 1440.67 on Sep 28, 2012. S&P 500 was trading between 1439.01 and 1470.96 which is a swing of about 32 points.
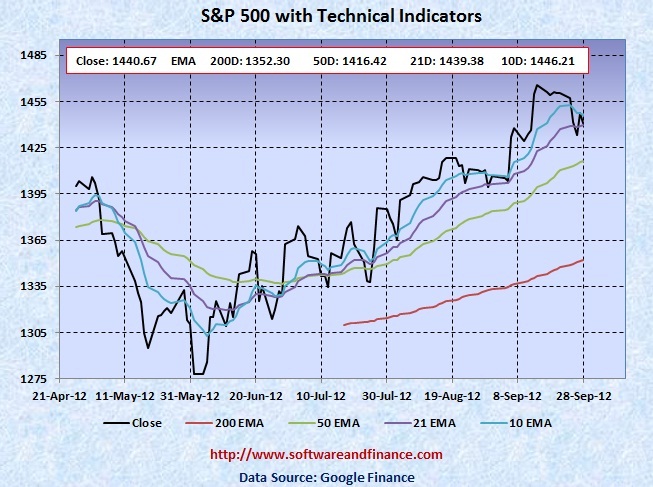
Sep 28, 2012 - S&P 500 closed today at 1440.67 which near about 20 points down compared to last week close of 1460.15 on Sep 21, 2012. S&P 500 was trading between 1430.53 and 1463.24 which is a swing of about 33 points.
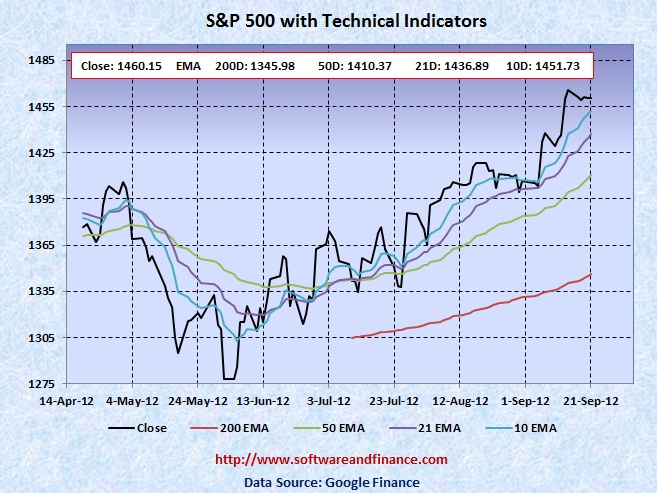
Sep 21, 2012 - S&P 500 closed today at 1460.15 which near flat compared to last week close of 1465.77 on Sep 14, 2012. S&P 500 was trading in narrow range between 1449.98 and 1467.07 which is a swing of about 17 points.
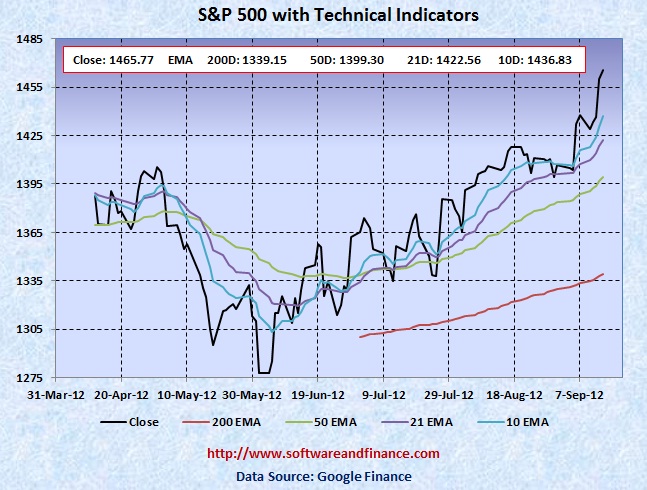
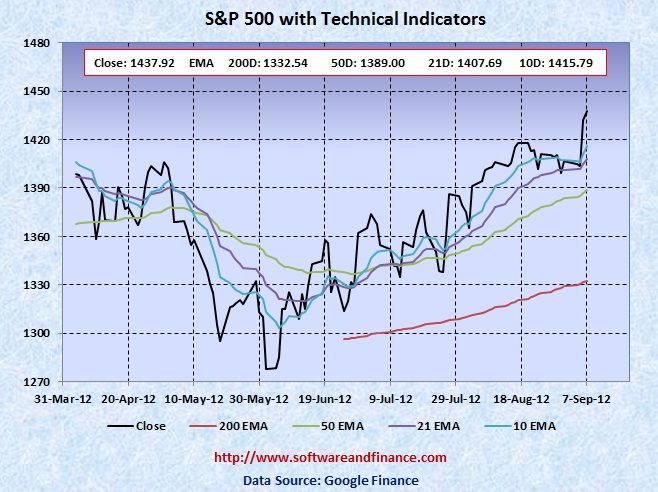
Sep 14, 2012 - S&P 500 closed today 1465.77 which is about 28 points up compared to last week close of 1437.92 on Sep 07, 2012. S&P 500 was trading between 1428.98 and 1474.51 which is a swing of about 46 points.
Sep 07, 2012 - S&P 500 closed today 1437.92 which is about 31 points up compared to last week close of 1406.58 on Aug 31, 2012. S&P 500 was trading between 1,396.56 and 1,437.92 which is a swing of about 41 points.
Aug 31, 2012 - S&P 500 closed today 1406.58 which is about 5 points down compared to last week close of 1411.13 on Aug 24, 2012. S&P 500 was trading between 1397.01 and 1416.17 which is a swing of about 19 points.
Aug 25, 2012 - S&P 500 closed today 1411.13 which is about 7 points down compared to last week close of 1418.16 on Aug 17, 2012. S&P 500 was trading between 1398.04 and 1426.68 which is a swing of about 28 points.
Aug 10, 2012 - S&P 500 closed today 1405.97 which is about 15 points gain compared to last week close of 1390.99 on Aug 03, 2012. S&P 500 was trading between 1391.04 and 1407.14 which is a swing of about 16 points.
Aug 03, 2012 - S&P 500 closed today 1390.99 which is near compared to last week close of 1385.97 on July 27, 2012. S&P 500 was trading between 1354.65 and 1394.16 which is a swing of about 40 points.
July 27, 2012 - S&P 500 closed today 1385.97 which is a strong gain of 1.71% compared to last week close of 1362.66 on July 20, 2012. S&P 500 was trading between 1329.24 and 1389.19 which is a swing of 60 points.
July 20, 2012 - S&P 500 closed today 1362.66 which is a little gain compared to last week close of 1356.78 on July 13, 2012. S&P 500 was trading between 1345.07 and 1380.39 which is a swing of 35 points.
July 13, 2012 - S&P 500 closed today 1356.78 which is near flat compared to last week close of 1354.68 on July 06, 2012. S&P 500 was trading between 1325.41 and 1361.54 which is a swing of 36 points.
S&P 500 Forecast From July 09, 2012 - Go back to 200 days EMA! (Expected Trading Range: 1278 - 1355)
July 06, 2012 - S&P 500 closed today 1354.68 which is about 7 points down compared to last week close of 1362.16 on June 29, 2012. S&P 500 was trading between 1348.03 and 1374.81 which is a swing of 27 points.
S&P 500 Forecast From July 02, 2012 - Do not trust this rally! (Expected Trading Range: 1278 - 1355)
Jun 29, 2012 - S&P 500 closed today 1362.16 which is about 27 points up compared to last week close of 1335.02 on June 22, 2012. S&P 500 was trading between 1309.27 and 1362.17 which is a swing of 53 points.
S&P 500 Forecast From Jun 25, 2012 - Get Ready For Free Fall! (Expected Trading Range: 1278 - 1352)
Jun 22, 2012 - S&P 500 closed today 1335.02 at which is about 8 points down compared to last week close of 1342.84 on June 15, 2012. S&P 500 was trading between 1324.41 and 1363.46 which is a swing of 39 points.
Jun 15, 2012 - S&P 500 closed today 1342.84 at which is about 17 points up compared to last week close of 1325.66 on June 08, 2012. S&P 500 was trading between 1306.62 and 1343.32 which is a swing of 37 points.
Jun 08, 2012 - S&P 500 closed today at 1325.66 which is about 48 points up compared to last week close of 1278.04 on June 01, 2012. S&P 500 was trading between 1266.74 and 1329.05 which is a swing of 62 points.
Jun 01, 2012 - S&P 500 closed today at 1278.04 which is about 40 points down compared to last week close of 1317.82 on May 25, 2012. S&P 500 was trading between 1277.25 and 1334.93 which is a swing of 58 points.
May 25, 2012 - S&P 500 closed today at 1317.82 which is about 23 points up compared to last week close of 1295.12 on May 18, 2012. S&P 500 was trading between 1295.73 and 1328.49 which is a swing of 33 points. Note that US Market is closed on May 28, 2012 for Memorial Day.
May 18, 2012 - S&P 500 closed today at 1295.12 which is about 58 points down (4.31%) compared to last week close of 1353.39 on May 11, 2012. S&P 500 was trading between 1291.98 and 1351.93 which is a swing of 60 points.
May 11, 2012 - S&P 500 closed today at 1353.39 which is about 16 points down compared to last week close of 1369.10 on May 04, 2012. S&P 500 was trading between 1343.13 and 1373.91 which is a swing of 31 points.
S&P 500 Forecast From May 07, 2012 - Free Fall towards 1309! (Expected Trading Range: 1300 - 1377)
May 04, 2012 - S&P 500 closed today at 1369.10 which is about 34 points down compared to last week close of 1403.36 on April 27, 2012. S&P 500 was trading between 1367.96 and 1415.32 which is a swing of 47 points.
Apr 27, 2012 - S&P 500 closed today at 1403.36 which is about 25 points up compared to last week close of 1378.53 on April 20, 2012. S&P 500 was trading between 1358.79 and 1406.64 which is a swing of 48 points.
Apr 20, 2012 - S&P 500 closed today at 1378.53 which is about 8 points up compared to last week close of 1370.26 on April 13, 2012. S&P 500 was trading between 1365.38 and 1392.76 which is a swing of 27 points.
Apr 13, 2012 - S&P 500 closed today at 1370.26 which is about 28 points down compared to last week close of 1398.08 on April 05, 2012. S&P 500 was trading between 1357.38 and 1397.45 which is a swing of 40 points. S&P 500 was up about 8.96% year to date.
Apr 05, 2012 - S&P 500 closed today at 1398.08 which is about 10 points down compared to last week close of 1408.47 on Mar 30, 2012. S&P 500 was trading between 1392.92 and 1422.38 which is a swing of 29 points. S&P 500 was up about 11.17% year to date.
Mar 30, 2012 - S&P 500 closed today at 1408.47 which is about 11 points up compared to last week close of 1397.11 on Mar 23, 2012. S&P 500 was trading between 1391.56 and 1419.15 which is a swing of 28 points. S&P 500 was up about 12% year to date and best quarter since 1998.
Mar 23, 2012 - S&P 500 closed today at 1397.11 which is about 7 points down compared to last week close of 1404.17 on Mar 16, 2012. S&P 500 was trading between between 1386.87 and 1414.00 which is a swing of 27 points. S&P 500 was up 11.09% year to date.
Mar 16, 2012 - S&P 500 closed today at 1404.17 which is a gain of 2.43% compared to last week close of 1370.87 on Mar 09, 2012. S&P 500 was trading between between 1366.69 and 1405.88 which is a swing of 39 points. S&P 500 was up 11.65% year to date.
Mar 09, 2012 - S&P 500 closed today at 1370.87 which is near flat compared to last week close of 1368.32 on Mar 02, 2012. S&P 500 was trading between between 1340.03 - 1374.76 which is a swing of 35 points.
Mar 02, 2012 - S&P 500 closed today at 1368.32 which is near flat compared to last week close of 1365.74 on Feb 24, 2012. S&P 500 was trading between between 1354.92 - 1378.04 which is a swing of 23 points.
Feb 24, 2012 - S&P 500 closed today at 1365.74 which is near flat compared to last week close of 1361.23 on Feb 17, 2012. S&P 500 was trading between between 1352.28 - 1368.92 which is a swing of 16 points.
Feb 17, 2012 - S&P 500 closed today at 1361.23 which is a gain of 1.38% compared to last week close of 1342.64 on Feb 10, 2012. S&P 500 was trading between between 1340.80 - 1363.40 which is a swing of 23 points.
Feb 10, 2012 - S&P 500 closed today at 1342.64 which is near flat compared to last week close of 1344.90 on Feb 03, 2012. S&P 500 was trading between between 1325.92 - 1354.32 which is a swing of 18 points.
Feb 03, 2012 - S&P 500 closed today at 1344.90 which is about 2.17% up compared to last week close of 1316.33 on Jan 27, 2012. S&P 500 was trading between between 1300.49 - 1345.34 which is a swing of 45 points.
Jan 27, 2012 - S&P 500 closed today at 1316.33 which is near flat compared to last week close of 1315.38 on Jan 20, 2012. S&P 500 was trading between between 1306.06 - 1333.47 which is a swing of 27 points.
Jan 20, 2012 - S&P 500 closed today at 1315.38 which is 26 points up compared to last week close of 1289.09 on Jan 13, 2012. S&P 500 was trading between between 1290.22 and 1315.49 which is a swing of 25 points.
Jan 13, 2012 - S&P 500 closed today at 1289.09 which is 11.28 points up compared to last week close of 1277.81 on Jan 06, 2012. S&P 500 was trading between between 1274.55 and 1296.82 which is a swing of 22 points.
Jan 06, 2012 - S&P 500 closed today at 1277.81 which is 20 points up compared to last week close of 1257.60 on Dec 30, 2011. S&P 500 was trading between between 1258.84 and 1284.62.
Dec 30, 2011 - S&P 500 closed today at 1257.60 which is 8 points down compared to last week close of 1265.33 on Dec 23, 2011. S&P 500 was trading between between 1248.64 and 1269.37.
Dec 23, 2011 - S&P 500 closed today at 1265.33 which is 46 points up compared to last week close of 1219.66 on Dec 16, 2011. S&P 500 was trading between between 1202.37 and 1265.42.
Dec 16, 2011 - S&P 500 closed today at 1219.66 which is just 36 points down compared to last week close of 1255.19 on Dec 09, 2011. S&P 500 was trading between between 1209.47 and 1255.05.
Dec 09, 2011 - S&P 500 closed today at 1255.19 which is just 10 points up compared to last week close of 1244.28 on Dec 02, 2011. S&P 500 was trading between between 1231.47 and 1267.06.
Dec 02, 2011 - S&P 500 closed today at 1244.28 which is 86 points (7.18%) up compared to last week close of 1158.67 on Nov 25, 2011. S&P 500 was trading between between 1158.67 and 1260.08.
Nov 25, 2011 - S&P 500 closed today at 1158.67 which is 57 points (4.69%) down compared to last week close of 1215.65 on Nov 18, 2011. S&P 500 was trading between between 1215.62 and 1158.66 in the Thanks Giving Holiday Shortened week.
Nov 18, 2011 - S&P 500 closed today at 1215.65 which is 48 points (3.81%) down compared to last week close of 1263.85 on Nov 11, 2011. S&P 500 was trading between between 1264.25 and 1209.43 in the last week.
Nov 11, 2011 - S&P 500 closed today at 1263.85 which is flat compared to last week close of 1253.23 on Nov 04, 2011. S&P 500 was trading between between 1226.64 and 1277.55 in the last week.
Nov 04, 2011 - S&P 500 closed today at 1253.23 which is 32 points down (2.48%) compared to last week close of 1285.08 on Oct 28, 2011. S&P 500 was trading between between 1215.42 and 1263.21 in the last week.
Oct 28, 2011 - S&P 500 closed today at 1285.08 which is 47 points up (3.78%) compared to last week close of 1238.25 on Oct 21, 2011. S&P 500 was trading between between 1221.06 and 1292.66 in the last week.
Oct 21, 2011 - S&P 500 closed today at 1238.25 which is 14 points up compared to last week close of 1224.58 on Oct 14, 2011. S&P 500 was trading between between 1191.48 and 1239.03 in the last week.
Oct 14, 2011 - S&P 500 closed today at 1224.58 which is 69 points (5.98%) up compared to last week close of 1155.46 on Oct 07, 2011. S&P 500 was trading between between 1158.15 and 1224.61 in the last week.
Oct 07, 2011 - S&P 500 closed today 1155.46 at which is 24 points up compared to last week close of 1131.42 on Sep 30, 2011. S&P 500 experienced a wild swing of about 95 points between 1074.77 and 1171.40 in the last week.
S&P 500 Forecast From Oct 03, 2011 - Market to retest its next support level 1036 ?
Sep 30, 2011 - S&P 500 closed today at 1131.42 which is almost flat compared to last week close of 1136.43 on Sep 23, 2011. S&P 500 experienced a swing of about 65 points between 1131.07 and 1195.86 in the last week.
S&P 500 Forecast From Sep 26, 2011 - Get Ready for Bear Market Rally
Sep 23, 2011 - S&P 500 closed today at 1136.43 which is about 80 points down compared to last week close of 1216.01 on Sep 16, 2011. S&P 500 experienced a huge swing of about 106 points between 1114.22 and 1220.39 in the last week.
S&P 500 Forecast From Sep 19, 2011 - Option Strip or Short and hedge with the recent rally
Sep 16, 2011 - S&P 500 closed today at 1216.01 which is about 62 points up compared to last week close of 1154.23 on Sep 09, 2011. S&P 500 experienced a swing of about 84 points between 1136.07 and 1220.06 in the last week.
S&P 500 Forecast From Sep 12, 2011 - Continue Betting on Volatility and Shorting on US Treasuries
Sep 09, 2011 - S&P 500 closed today at 1154.23 which is about 20 points down compared to last week close of 1173.97 on Sep 02, 2011. S&P 500 experienced a swing of about 64 points between 1140.13 and 1204.40 in the holiday shortened week.
S&P 500 Forecast From Sep 05, 2011 - Betting on Volatility and Shorting on US Treasuries
Sep 02, 2011 - S&P 500 closed today at 1173.97 which is almost flat compared to last week close of 1176.80 on August 26, 2011.
S&P 500 Forecast From Aug 29, 2011 - Market is consolidating at current levels for a big rally
August 26, 2011 - S&P 500 closed today at 1176.80 which is about 53 points up compared to last week close of 1123.53 on August 19, 2011.
S&P 500 Forecast From Aug 22, 2011 - Time to go with Long Position
August 19, 2011 - S&P 500 closed today at 1123.53 which is about 55 points down compared to last week close of 1178.81 on August 12, 2011.
S&P 500 Forecast From Aug 15, 2011 - US$ is the only safe heaven
August 12, 2011 - S&P 500 closed today at 1178.81 which is about 20.57 points down compared to last week close of 1200.28 on August 05, 2011. Even though the number looks good, last week experienced a massive volatility in the US stock market in every other day with US debt downgrade by S&P. Last week low point is 1101.54.
S&P 500 Forecast From Aug 08, 2011 - US$ is the only safe heaven
August 05, 2011 - S&P 500 closed today at 1199.38 which is about 92.9 points down (more than 7%) compared to last week close of 1,292.28 on July 29, 2011.
S&P 500 Forecast From Aug 01, 2011 - Betting on Volatility
July 29, 2011 - S&P 500 closed today at 1298.28 which is about 46 points down compared to last week close of 1,345.02 on July 22, 2011.
S&P 500 Forecast From Jul 25, 2011 - Betting on Volatility
July 22, 2011 - S&P 500 closed today at 1,345.02 which is about 29 points up compared to last week close of 1316.14 on July 15, 2011.
S&P 500 Forecast From Jul 18, 2011 - Buy US long dated Treasuries and US$
July 15, 2011 - S&P 500 closed today at 1,316.14 which is about 28 points down compared to last week close of 1343.80 on July 08, 2011.
S&P 500 Forecast From Jul 11, 2011 - Buy US long dated Treasuries and US$
July 08, 2011 - S&P 500 closed today 1343.80 at which is almost flat compared to last week close of 1339.67 on July 01, 2011.
|
|