S&P 500 Forecast From March 12, 2012 - Get ready for free fall! (Expected Trading Range: 1277 - 1382)
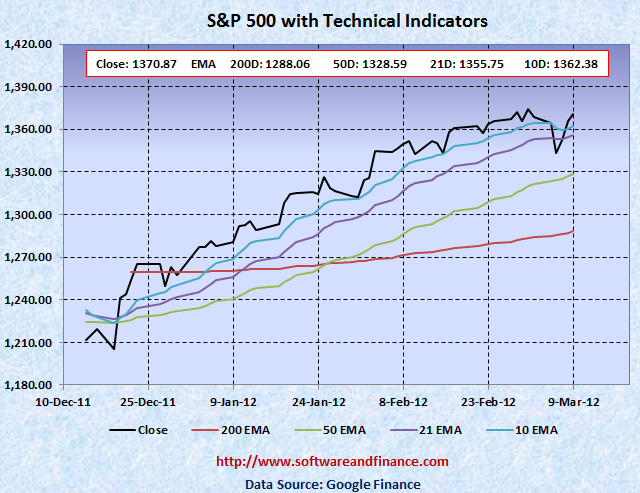
Mar 09, 2012 - S&P 500 closed today at 1370.87 which is near flat compared to last week close of 1368.32 on Mar 02, 2012. S&P 500 was trading between between 1340.03 - 1374.76 which is a swing of 35 points.
To watch S&P 500 Index in google finance, visit the following link:
S&P 500 Index in Google Finance
To watch S&P 500 Index in yahoo finance, visit the following link:
S&P 500 Index in Yahoo Finance
Last Week Analysis - Stocks are setting lower lows and lower highs
For the last 3 weeks stocks are not making any big movement in either direction and trading in a flat line shows that market is consolidating now to take a major steep down. Stocks have set lower lows and lower highs compared to earlier week also signaling the free fall. Greedy hedge fund managers keep betting more and more on the market direction to create a bubble. They will not hesitate to stop betting until Nasdaq reaches 3,000.00, Dow Jones reaches 13,000.00 and S&P 500 reaches 1,400.00. It is nothing but to touch the fancy number before it moves down significantly and this is the time when the Nasdaq Tech bubble will burst.
Some people think that the economic problems in Euro Zone is only for Europe but it is not true. When a country/region experiences a slow down it will have domino effect on other countries very quickly as the world market is currently tightly connected.
FYI - France will hold presidential elections on April 22 and May 6, followed by general elections in June.
US will hold presidential elections on Nov 06, 2012.
With respect to US long term treasury prices, TLT closed today at 115.97 which is about 1 % down for the week compared to last week close of 117.14. US treasury is now too late to short and too early to buy. But if you are short on US treasuries, you can liquidate your short position. US treasuries (Ticker: TLT) would bottom near 100 - 103 and TLT upside would be maximum of 125-130. Note that even though market rallied for the last two weeks, TLT is flat in the same period. Most knowledgable investors had already started moving towards US treasuries.
Last Week Low: 1340.03
Last Week High: 1374.76
If you are a long term conservative investors,
1. It is the time to liquidate your short position on US treasuries in the short term. TLT closed today at 115.16 and it would bottom near 100 - 103. The upside target is around 125. With VIX pointing below 18 signals that a strong rally on US treasuries are imminent.
2. US$ is only safe heaven. It is another good time to initiate short positions on S&P. Since S&P is trading above its 50 days EMA and 200 days EMA, some people might think that the bull market is back. But it is nothing but another bear market rally. Now stock market is ready for its free fall back to below 1100.
For Speculators and Intraday Players - Short Stocks with Stop Loss Orders and Long Options Strip
CBOE Volatility Index (VIX) flat for the last week. There is still a good chance for rally on VIX, it can go up to 40 in the short run. It is also good idea to take long positions on VIX. Still fundamentally the US market is very week due to unemployment and slumping house prices along with US debt downgrade. Always fundamental wins in the long run.
Only if you are day trader, you can have the following options:
1. Buy 2X OTM put option and 1X OTM call option.
2. Short Stocks and stop loss orders.
3. Short Stocks with long call options
Note: OTM - means Outside the money.
Technical Indicators
10 Days EMA: 1362.38
21 Days EMA: 1355.75
50 Days EMA: 1328.59
200 Days EMA: 1288.06
Next Resistance Levels:
strong resistance level at: 1345.02 set by Jul 22, 2011.
strong resistance level at: 1386.95 set on Mar 16, 2007
strong resistance level at: 1433.06 set on Aug 03, 2007
strong resistance level at: 1440.70 set on Nov 23, 2007
strong resistance level at: 1453.55 set on Sep 07, 2007
strong resistance level at: 1,530.23 set on May 30, 2007 (first closing high after dot com bubble)
strong resistance level at: 1,552.87 set on Mar 24, 2000 (all time high during dot com bubble)
strong resistance level at: 1,565.15 set on Oct 09, 2007 (all time high during housing buble before sub prime crisis)
Next Support Levels:
minor support leval at: 1328.59 set by 50 days EMA
strong support level at: 1288.06 set by 200 Days EMA.
strong support level at 1189.40 set on Nov 26, 2010
strong support level at 1119.46 set on Aug 08, 2011
minor support level at 1064.59 set on Aug 27, 2010
strong support level at 1022.58 set on Jul 02, 2010
strong support level at 1036.18 set on Oct 30, 2009
strong support level at 946.21 set on Jun 12, 2009
strong support level at 827.37 set on Sep 27, 2002
strong support level at 683.38 set on Mar 06, 2009
strong support level at 638.73 set on Jul 19, 1996 - Might see this number again when completing double dip bottom
Posted on March 10, 2012
|
|