S&P 500 Forecast From Oct 22, 2012 - Earning shows the reality! (Expected Trading Range: 1352 - 1566)
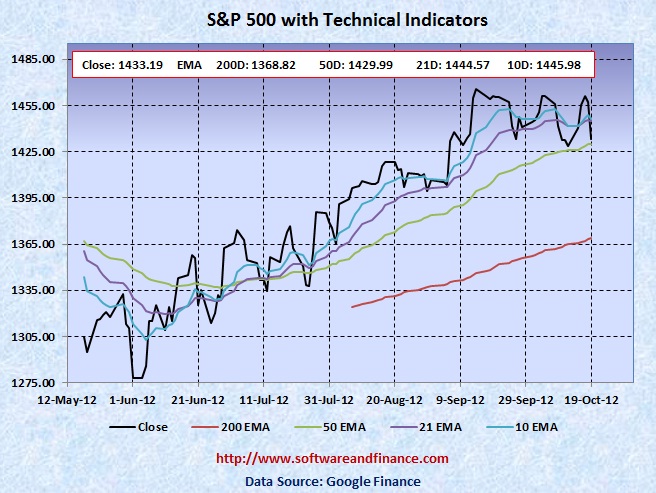
Oct 19, 2012 - S&P 500 closed today at 1433.19 which is about 4 points up compared to last week close of 1428.59 on Oct 12, 2012. S&P 500 was trading between 1427.24 and 1464.02 which is a swing of about 37 points.
To watch S&P 500 Index in google finance, visit the following link:
S&P 500 Index in Google Finance
To watch S&P 500 Index in yahoo finance, visit the following link:
S&P 500 Index in Yahoo Finance
Last Week Analysis - Google Earning Shows the Reality
No matter what, Fed has already created the credit bubble by keeping the interest rate low for about 4 years. And this credit bubble will burst; this is going to be a very surprise and another disaster to the economy. The american workforce dropped to the lowest level in 31 years. Market is getting ready to crash! But the only question is whether it will happen immediately before or immediately after the US presidential election. Porlonged rate cuts helped to create new Jobs and reduce the unemployment news. Which in turn becomes negative on increasing the interest rate that is not positive for the market. In another look, market will not care about increasing the interest rate.
The big suprise news for the market is the premature earning release from Google during the market hours which turned the GOOG stock trading to halt for the rest of the day. Google earnings was a big surprise to the market since they also face same problem with theirs ads on mobile. Due to the increasing mobile users, mobile content does not have enough space to display the ad units as in PCs.
US will hold presidential elections on Nov 06, 2012
With respect to US long term treasury prices, TLT closed today at 121.71 which is a another slump from the last week close of 123.97. TLT reached its all time high point of 132.21 on July 25, 2012. In the short time, TLT may make a siginificant upward move. So if you are trading on US treasuries in the short term, it is a good time to take long position on US treasuries.
Last Week Low: 1427.24
Last Week High: 1464.02
If you are a medium or long term conservative investors,
1. Initate short position on US treasuries.
2. Liquidate your long positions on Stocks and convert them to cash (US$)
For Speculators and Intraday Players - Bet on Volatility
CBOE Volatility Index (VIX) closed today at 17.06 which a another recovery from the last week close of 16.14. Now the market is showing some fear compared to the earlier weeks, but still VIX is going to make a powerful upmove Since fundamentally the US market is very week due to unemployment and slumping house prices along with US debt downgrade. Always fundamental wins in the long run. You can consider taking long positios on VIX also.
Only if you are day trader, you can have the following options:
1. Buy 1X OTM call option and 2X OTM put option - Long Strip.
2. Long Stocks and stop loss orders
3. Long Stocks with long put options
Note: OTM - means Outside the money.
Technical Indicators
Next Resistance Levels:
strong resistance level at: 1433.06 set on Aug 03, 2007
strong resistance level at: 1440.70 set on Nov 23, 2007
strong resistance level at: 1453.55 set on Sep 07, 2007
strong resistance level at: 1500 - crazy market move
strong resistance level at: 1,530.23 set on May 30, 2007 (first closing high after dot com bubble)
strong resistance level at: 1,552.87 set on Mar 24, 2000 (all time high during dot com bubble)
strong resistance level at: 1,565.15 set on Oct 09, 2007 (all time high during housing buble before sub prime crisis)
Next Support Levels:
strong support level at: 1429.99 set 50 Days EMA.
strong support level at: 1368.82 set by 200 Days EMA.
strong support level at 1189.40 set on Nov 26, 2010
strong support level at 1119.46 set on Aug 08, 2011
minor support level at 1064.59 set on Aug 27, 2010
strong support level at 1022.58 set on Jul 02, 2010
strong support level at 1036.18 set on Oct 30, 2009
strong support level at 946.21 set on Jun 12, 2009
strong support level at 827.37 set on Sep 27, 2002
strong support level at 683.38 set on Mar 06, 2009
strong support level at 638.73 set on Jul 19, 1996 - Might see this number again when completing double dip bottom.
Posted on Oct 21, 2012
|
|