S&P 500 Forecast From Sep 17, 2012 - Fed Move Helps Testing all time high before US election! (Expected Trading Range: 1340 - 1475)
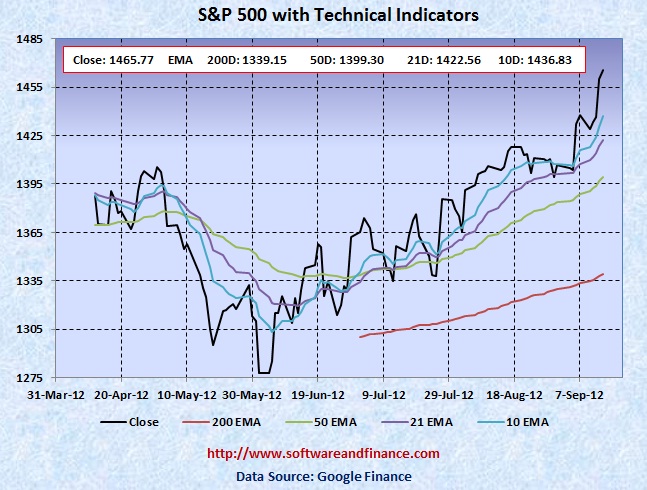
Sep 14, 2012 - S&P 500 closed today 1465.77 which is about 28 points up compared to last week close of 1437.92 on Sep 07, 2012. S&P 500 was trading between 1428.98 and 1474.51 which is a swing of about 46 points.
To watch S&P 500 Index in google finance, visit the following link:
S&P 500 Index in Google Finance
To watch S&P 500 Index in yahoo finance, visit the following link:
S&P 500 Index in Yahoo Finance
Last Week Analysis - FOMC Minutes Pushed S&P to multi-year high
Follwed by FOMC 2 day meeting (12th and 13th), S&P could set a new 52 high of 1474.51. The Fed statement created more positive sentiment on the market. However it is always to go be a wrong choice for novice investors. Market was going up beliving that S&P will touch its all time high of 1565.15 again! Currently it is just 90 points down for S&P 500. A strong 2 days rally can help to push the market to set a new all time high before US presidential election.
Fed mentioned that it is going purchase 40 billion per month towards mortgage-backed securities. The following is the link to read the complete Fed Statement release on Sep 13, 2012.
http://www.federalreserve.gov/newsevents/press/monetary/20120913a.htm
No matter what, Fed has already created the credit bubble by keeping the interest rate low for over 3 years. And this credit bubble will burst; this is going to be a very surprise and another disaster to the economy. The americal workforce dropped to the lowest level in 31 years. Market is getting ready to crash! But the only question is whether it will happen immediately before or immediately after the US presidential election.
US will hold presidential elections on Nov 06, 2012
With respect to US long term treasury prices, TLT closed today at 118.30 which is a big loss of 4.62% for this week compared to the last week close of 124.03. However TLT reached its all time high point of 132.21 on July 25, 2012. Now TLT is trading at 3 months low. In the short time, TLT may make a siginificant upward move. So if you are trading on US treasuries in the short term, it is a good time to take long position on US treasuries.
Last Week Low: 1428.98
Last Week High: 1474.51
If you are a medium or long term conservative investors,
1. Initate short position on US treasuries.
2. Liquidate your long positions on Stocks and convert them to cash (US$)
For Speculators and Intraday Players - Bet on Volatility
CBOE Volatility Index (VIX) closed today at 14.51 which near flat from the last week low of 14.38. The strong slump in VIX in the recent past signals that market does not have any fear and is going to make a powerful upmove. Still fundamentally the US market is very week due to unemployment and slumping house prices along with US debt downgrade. Always fundamental wins in the long run. You can consider taking long positios on VIX also.
Only if you are day trader, you can have the following options:
1. Buy 1X OTM call option and 2X OTM put option - Long Strip.
2. Long Stocks and stop loss orders
3. Long Stocks with long put options
Note: OTM - means Outside the money.
Technical Indicators
Next Resistance Levels:
strong resistance level at: 1565.15 set on Oct 9, 2007 [All time high]
strong resistance level at: 1413.38 set on April 3, 2012
strong resistance level at: 1400 - crazy market move
strong resistance level at: 1345.02 set on Jul 22, 2011.
strong resistance level at: 1348.24 set by 50 days EMA.
strong resistance level at: 1386.95 set on Mar 16, 2007
strong resistance level at: 1433.06 set on Aug 03, 2007
strong resistance level at: 1440.70 set on Nov 23, 2007
strong resistance level at: 1453.55 set on Sep 07, 2007
strong resistance level at: 1,530.23 set on May 30, 2007 (first closing high after dot com bubble)
strong resistance level at: 1,552.87 set on Mar 24, 2000 (all time high during dot com bubble)
strong resistance level at: 1,565.15 set on Oct 09, 2007 (all time high during housing buble before sub prime crisis)
Next Support Levels:
strong support level at: 1339.15 set by 200 Days EMA.
strong support level at 1189.40 set on Nov 26, 2010
strong support level at 1119.46 set on Aug 08, 2011
minor support level at 1064.59 set on Aug 27, 2010
strong support level at 1022.58 set on Jul 02, 2010
strong support level at 1036.18 set on Oct 30, 2009
strong support level at 946.21 set on Jun 12, 2009
strong support level at 827.37 set on Sep 27, 2002
strong support level at 683.38 set on Mar 06, 2009
strong support level at 638.73 set on Jul 19, 1996 - Might see this number again when completing double dip bottom
Posted on Sep 16, 2012
|
|