S&P 500 Forecast From Dec 26, 2011 - Short S&P betting fall back from its 200 days EMA(Expected Trading Range: 1158 - 1265)
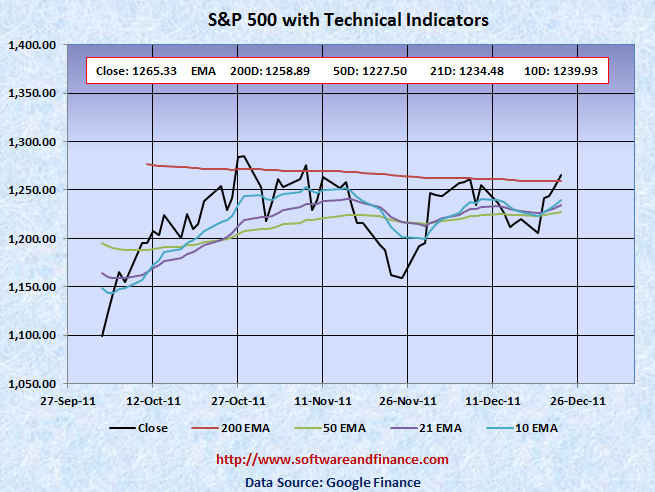
Dec 23, 2011 - S&P 500 closed today at 1265.33 which is 46 points up compared to last week close of 1219.66 on Dec 16, 2011. S&P 500 was trading between between 1202.37 and 1265.42.
Note: US Market will be closed on Monday on Christmas Holiday (Observed)
To watch S&P 500 Index in google finance, visit the following link:
S&P 500 Index in Google Finance
To watch S&P 500 Index in yahoo finance, visit the following link:
S&P 500 Index in Yahoo Finance
Last Week Analysis - Fake Rally towards its 200 days EMA
S&P 500 closed about 46 points up for the last week by swinging in either direction. S&P testing couple of times its 200 days EMA and 50 days EMA signaling market is going to enter bear market very soon.
With respect to US long term treasury prices, TLT closed today at 118.17 which a loss of 3.4% for the week compared to last week close of 122.34. US treasury is a bit late to create short position and very early to create long position. US treasuries (Ticker: TLT) would bottom near 100 - 103 and TLT upside would be maximum of 125-130. Alternatively you can consider buying TMV.
Note: US Interest Rate Bottom is currently happening, it may test the bottom in the coming week.
Last Week Low: 1202.37
Last Week High: 1265.42
If you are a long term conservative investors,
1. It is the time to hold short position on US treasuries on long term. TLT closed today at 118.27 and it would bottom near 100 - 103. The upside target is around 125.
2. US Treasury prices started moving up with retesting the interest rate bottom. Still Fed Fed would on QE3 announcement until the yieds are very high and the prices are very low. Front running the Fed is not a good strategy in investment.
3. US$ is only safe heaven. It is another good time to initiate short positions on S&P. Since S&P is trading around its 50 days EMA and 200 days EMA, It is unlikely the market will have a bull run crossing this point. There might be a fake rally for a day or two to confuse novice investers to put them on long side, before market makes a significant down move.
For Speculators and Intraday Players - Short Stocks with Stop Loss Orders and Long Options Strip
CBOE Volatility Index (VIX) also trading volatile and closed at 20.73 which is down by 4 points for the last week. There is a good chance for rally on VIX, it can go up to 40 in the short run. Still fundamentally the US market is very week due to unemployment and slumping house prices along with US debt downgrade. Always fundamental wins in the long run.
Only if you are day trader, you can have the following options:
1. Buy 2X OTM put option and 1X OTM call option.
2. Short Stocks and stop loss orders.
3. Short Stocks with long call options
Note: OTM - means Outside the money.
Technical Indicators
10 Days EMA: 1239.93
21 Days EMA: 1234.48
50 Days EMA: 1227.50
200 Days EMA: 1258.89
Next Resistance Levels:
strong resistance level at: 1258.89 set by 200 Days EMA.
strong resistance level at: 1386.95 set on Mar 16, 2007
strong resistance level at: 1433.06 set on Aug 03, 2007
strong resistance level at: 1440.70 set on Nov 23, 2007
strong resistance level at: 1453.55 set on Sep 07, 2007
strong resistance level at: 1,530.23 set on May 30, 2007 (first closing high after dot com bubble)
strong resistance level at: 1,552.87 set on Mar 24, 2000 (all time high during dot com bubble)
strong resistance level at: 1,565.15 set on Oct 09, 2007 (all time high during housing buble before sub prime crisis)
Next Support Levels:
minor support leval at: 1227.50 set by 50 days EMA
strong support level at 1189.40 set on Nov 26, 2010
strong support level at 1119.46 set on Aug 08, 2011
minor support level at 1064.59 set on Aug 27, 2010
strong support level at 1022.58 set on Jul 02, 2010
strong support level at 1036.18 set on Oct 30, 2009
strong support level at 946.21 set on Jun 12, 2009
strong support level at 827.37 set on Sep 27, 2002
strong support level at 683.38 set on Mar 06, 2009
strong support level at 638.73 set on Jul 19, 1996 - Might see this number again when completing double dip bottom
Posted on Dec 24, 2011
|
|