S&P 500 Technical Forecast From Aug 01, 2011 - Betting on Volatility
July 29, 2011 - S&P 500 closed today at 1298.28 which is about 46 points down compared to last week close of 1,345.02 on July 22, 2011.
To watch S&P 500 Index in google finance, visit the following link:
S&P 500 Index in Google Finance
To watch S&P 500 Index in yahoo finance, visit the following link:
S&P 500 Index in Yahoo Finance
Last Week Analysis
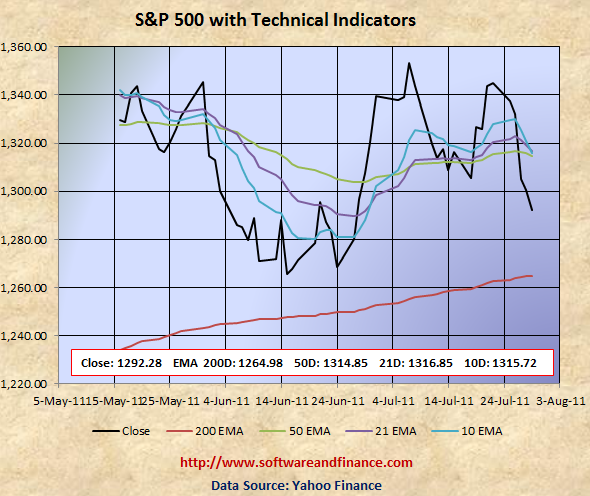
Let's look the S&P technical levels in the following chart. S&P 500 is currently broken with its 10 days, 21 days, 50 days. Currently technicals does not look good and it is ready to retest its 200 days EMA of 1264.98.
Last Week Low: 1282.86 (Ready to take free fall its 200 days EMA)
Last Week High: 1344.32 (About 30 points up from 21 and 50 days EMA)
If you are a long term conservative investors, then you have to switch your investment strategy and move on the Fixed Income Securities - Govt. Bonds, US Long dated Treasuries (TLT), US Dollar (UUP), etc.
If you are a long term risky player in the market, then you can initiate short position and accumulate short position gradually in the coming weeks. You can not expect return in the short term.
For Speculators and Intraday Players
The debt talks, earning season and on going crisis from Euro Zone will increase the volatility. Buying VIX call options might be good idea but both the risk and reward are very high. Better not to play VIX if you are conservative. Fundamentally the US market is very week due to unemployment and slumping house prices along with US debt fears and possible downgrade. Always fundamental wins in the long run.
Only if you are day trader, you can have the following two options:
1. Short the market and hedge using long call options - known as short position with call hedge.
2. Buy 2X times of put options and 1X time of call option - known as option strip.
Technical Indicators
10 Days EMA 1315.72
21 Days EMA 1316.85
50 Days EMA 1314.85
200 Days EMA 1264.98
Next Resistance Levels:
resistance level at: 1314.85 set by 50 days EMA
strong resistance level at: 1386.95 set on Mar 16, 2007
strong resistance level at: 1433.06 set on Aug 03, 2007
strong resistance level at: 1440.70 set on Nov 23, 2007
strong resistance level at: 1453.55 set on Sep 07, 2007
strong resistance level at: 1,530.23 set on May 30, 2007 (first closing high after dot com bubble)
strong resistance level at: 1,552.87 set on Mar 24, 2000 (all time high during dot com bubble)
strong resistance level at: 1,565.15 set on Oct 09, 2007 (all time high during housing buble before sub prime crisis)
Next Support Levels:
strong support level at 1264.98 - 200 days EMA
strong support level at 1189.40 set on Nov 26, 2010
minor support level at 1064.59 set on Aug 27, 2010
strong support level at 1022.58 set on Jul 02, 2010
strong support level at 1036.18 set on Oct 30, 2009
strong support level at 946.21 set on Jun 12, 2009
strong support level at 827.37 set on Sep 27, 2002
strong support level at 683.38 set on Mar 06, 2009
strong support level at 638.73 set on Jul 19, 1996 - Might see this number again when completing double dip bottom
Posted on July 31, 2011
|
|