S&P 500 Forecast From March 19, 2012 - Rising Dollar and Interest Rate signals Market Top reached (Expected Trading Range: 1277 - 1433)
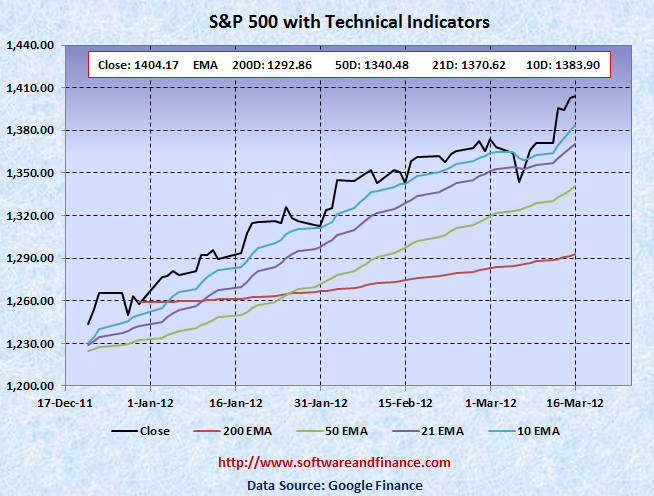
Mar 16, 2012 - S&P 500 closed today at 1404.17 which is a gain of 2.43% compared to last week close of 1370.87 on Mar 09, 2012. S&P 500 was trading between between 1366.69 and 1405.88 which is a swing of 39 points. S&P 500 was up 11.65% year to date.
To watch S&P 500 Index in google finance, visit the following link:
S&P 500 Index in Google Finance
To watch S&P 500 Index in yahoo finance, visit the following link:
S&P 500 Index in Yahoo Finance
Last Week Analysis - Bank Stress Test Fuels More Rally and Greedy Investors Satisfied!
US Banks stress test results came up with very positive is a good news but it is actually a bad news to the economy. Interest rate have been going up will potentially damage the home buyer's interest. 30 years Interest rate have been increased by 6.896% from 3.19 to 3.41. Rising interest rate and dollar will become another serious problem to the economy, especially to the tech sector. Nasdaq trading above 3000 points is a clear bubble. Rising dollar will potentially decrease the earning of technology sector since they are export based companies.
I have been mentioning that greedy investors will not hesitate to stop betting until Nasdaq reaches 3,000.00, Dow Jones reaches 13,000.00 and S&P 500 reaches 1,400.00 in the last couple of weeks. It is nothing but to touch the fancy number before it moves down significantly and this is the time when the Nasdaq Tech bubble will burst. Currently all indicies have crossed the upper bound.
Oil prices have been gone up so fast in the last 6 months. During election year, oil prices will be trading at low levels historically due to polictial interest. Besides rising dollar is the key factor now. Market bottom will be seen around election that is where when everything goes down except US$.
FYI - France will hold presidential elections on April 22 and May 6, followed by general elections in June.
US will hold presidential elections on Nov 06, 2012.
With respect to US long term treasury prices, TLT closed today at 111.43 which is about 4% down for the week compared to last week close of 115.97. US treasury is a good buy now since it touched and trading around its 200 days EMA of 110.00. But if you are short on US treasuries, you have to liquidate your short position. US treasuries (Ticker: TLT) TLT upside is huge now that is towards 125-130.
Last Week Low: 1366.69
Last Week High: 1405.88
If you are a long term conservative investors,
1. It is the time to liquidate your short position and go long on US treasuries. TLT closed today at 111.43 is a good but since the upside target is around 125. With VIX pointing below 15 signals that a strong rally on US treasuries are imminent.
2. US$ is only safe heaven. It is another good time to initiate short positions on S&P. Since S&P is trading above its 50 days EMA and 200 days EMA, some people might think that the bull market is back. But it is nothing but another bear market rally. Now stock market is ready for its free fall back to below 1100.
For Speculators and Intraday Players - Short Stocks with Stop Loss Orders and Long Options Strip
CBOE Volatility Index (VIX) flat for the last week. There is still a good chance for rally on VIX, it can go up to 40 in the short run. It is also good idea to take long positions on VIX. Still fundamentally the US market is very week due to unemployment and slumping house prices along with US debt downgrade. Always fundamental wins in the long run.
Only if you are day trader, you can have the following options:
1. Buy 2X OTM put option and 1X OTM call option.
2. Short Stocks and stop loss orders.
3. Short Stocks with long call options
Note: OTM - means Outside the money.
Technical Indicators
10 Days EMA: 1383.90
21 Days EMA: 1370.62
50 Days EMA: 1340.48
200 Days EMA: 1292.86
Next Resistance Levels:
strong resistance level at: 1345.02 set by Jul 22, 2011.
strong resistance level at: 1386.95 set on Mar 16, 2007
strong resistance level at: 1433.06 set on Aug 03, 2007
strong resistance level at: 1440.70 set on Nov 23, 2007
strong resistance level at: 1453.55 set on Sep 07, 2007
strong resistance level at: 1,530.23 set on May 30, 2007 (first closing high after dot com bubble)
strong resistance level at: 1,552.87 set on Mar 24, 2000 (all time high during dot com bubble)
strong resistance level at: 1,565.15 set on Oct 09, 2007 (all time high during housing buble before sub prime crisis)
Next Support Levels:
minor support leval at: 1340.48 set by 50 days EMA
strong support level at: 1292.86 set by 200 Days EMA.
strong support level at 1189.40 set on Nov 26, 2010
strong support level at 1119.46 set on Aug 08, 2011
minor support level at 1064.59 set on Aug 27, 2010
strong support level at 1022.58 set on Jul 02, 2010
strong support level at 1036.18 set on Oct 30, 2009
strong support level at 946.21 set on Jun 12, 2009
strong support level at 827.37 set on Sep 27, 2002
strong support level at 683.38 set on Mar 06, 2009
strong support level at 638.73 set on Jul 19, 1996 - Might see this number again when completing double dip bottom
Posted on March 17, 2012
|
|