S&P 500 Technical Forecast Weekly Starting July 18, 2011 - Buy US long dated Treasuries and US$
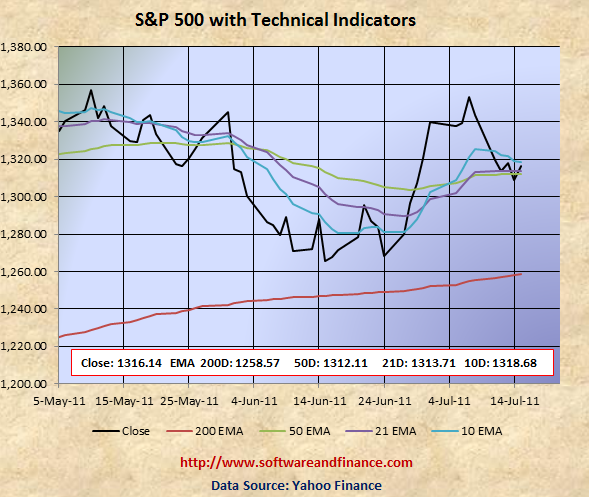
July 15, 2011 - S&P 500 closed today at 1,316.14 which is about 28 points down compared to last week close of 1343.80 on July 08, 2011.
Last Week Analysis
Let's look the S&P technical levels in the following chart. S&P 500 is currently above 21 days, 50 days and 200 days EMA. As technicals are still indicating the bull signal, It may try go higher but eventually it will have to come back to 200 days EMA of 1258.57. Market went down steeply on Monday by 24 points and the rest of the week, Market was searching for the direction.
The earnings from Google helped the Nasdaq to move higher late week.
If you are a long term conservative investors, then you have to switch your investment strategy and move on the Fixed Income Securities - Govt. Bonds, US Long dated Treasuries (TLT), US Dollar (UUP), etc.
If you are a long term risky player in the market, then you can initiate short position and accumulate short position gradually in the coming weeks. You can not expect return in the short term.
For Speculators and Intraday Players
The debt talks, earning season and on going crisis from Euro Zone will increase the volatility. Buying VIX call options might be good idea but both the risk and reward are very high. Better not to play VIX if you are conservative.
Only if you are day trader, you have to follow swing strategies. It is ok to bet on the volatility by betting either side (long and short) on the market. The reason for bull signal is based on technicals only. The technical indicators are correctly following the patters which means 10 days EMA is more than 21 days EMA, 21 days is more than 50 days EMA and 50 days EMA is more than 200 days EMA. This is a very clear indication for bull signal.
But fundamentally the US market is very week due to unemployment and slumping house prices. Always fundamental wins in the long run.
Based on technicals you can take long position on US stock market, but to protect the sudden collapse due to fundamentals, you must hedge your positions by buying put options.
Technical Indicators
10 Days EMA 1318.68
21 Days EMA 1313.71
50 Days EMA 1312.11
200 Days EMA 1258.57
Next Resistance Levels:
strong resistance level at: 1386.95 set on Mar 16, 2007
strong resistance level at: 1433.06 set on Aug 03, 2007
strong resistance level at: 1440.70 set on Nov 23, 2007
strong resistance level at: 1453.55 set on Sep 07, 2007
strong resistance level at: 1,530.23 set on May 30, 2007 (first closing high after dot com bubble)
strong resistance level at: 1,552.87 set on Mar 24, 2000 (all time high during dot com bubble)
strong resistance level at: 1,565.15 set on Oct 09, 2007 (all time high during housing buble before sub prime crisis)
Next Support Levels:
minor support level at 1312.11 - 50 Days EMA
strong support level at 1258.57 - 200 days EMA
strong support level at 1189.40 set on Nov 26, 2010
minor support level at 1064.59 set on Aug 27, 2010
strong support level at 1022.58 set on Jul 02, 2010
strong support level at 1036.18 set on Oct 30, 2009
strong support level at 946.21 set on Jun 12, 2009
strong support level at 827.37 set on Sep 27, 2002
strong support level at 683.38 set on Mar 06, 2009
strong support level at 638.73 set on Jul 19, 1996 - Might see this number again when completing double dip bottom
Posted on July 16, 2011
|
|