S&P 500 Forecast From July 23, 2012 - Consolidating at these levels for deeper correction! (Expected Trading Range: 1278 - 1378)
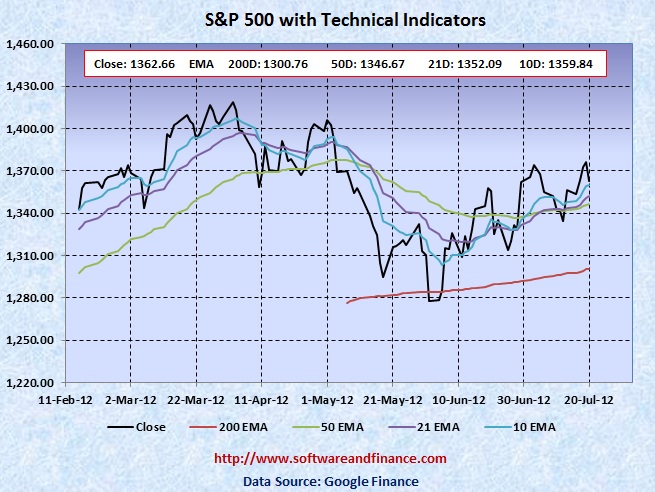
July 20, 2012 - S&P 500 closed today 1362.66 which is a little gain compared to last week close of 1356.78 on July 13, 2012. S&P 500 was trading between 1345.07 and 1380.39 which is a swing of 35 points.
To watch S&P 500 Index in google finance, visit the following link:
S&P 500 Index in Google Finance
To watch S&P 500 Index in yahoo finance, visit the following link:
S&P 500 Index in Yahoo Finance
Last Week Analysis - Earning Helped to stablize the market movement
Earning in the last week was impressive because of record low Federal Funds Rate for more than 3 and 1/2 years. Even though market rallied last week to the close, the stronger dollar will hurt the profit of the export companies in USA that can lead to the Nasdaq correction.
US will hold presidential elections on Nov 06, 2012
With respect to US long term treasury prices, TLT closed today at 130.4 which is little gain for this week compared to the last week close of 129.17. It is the perfect time to initate short position US treasuries. The upside is very much limited on US treasuries and downside is huge.
Last Week Low: 1,345.07
Last Week High: 1,380.39
If you are a medium or long term conservative investors,
1. Initate short position on US treasuries.
2. Liquidate your long positions on Stocks and convert them to cash (US$)
For Speculators and Intraday Players - Bet on Volatility
CBOE Volatility Index (VIX) closed today around 16.27 today which is near flat for the week. The collapse of VIX signals that market does not have any fear and is going to make a powerful upmove. Still fundamentally the US market is very week due to unemployment and slumping house prices along with US debt downgrade. Always fundamental wins in the long run. You can consider taking long positios on VIX also.
Only if you are day trader, you can have the following options:
1. Buy 1X OTM call option and 1X OTM put option - Long Strangle.
2. Long Stocks and stop loss orders
3. Long Stocks with long put options
Note: OTM - means Outside the money.
Technical Indicators
10 Days EMA: 1359.84
21 Days EMA: 1352.09
50 Days EMA: 1346.67
200 Days EMA: 1300.76
Next Resistance Levels:
strong resistance level at: 1400 - crazy market move
strong resistance level at: 1345.02 set by Jul 22, 2011.
strong resistance level at: 1346.67 set by 50 days EMA.
strong resistance level at: 1386.95 set on Mar 16, 2007
strong resistance level at: 1433.06 set on Aug 03, 2007
strong resistance level at: 1440.70 set on Nov 23, 2007
strong resistance level at: 1453.55 set on Sep 07, 2007
strong resistance level at: 1,530.23 set on May 30, 2007 (first closing high after dot com bubble)
strong resistance level at: 1,552.87 set on Mar 24, 2000 (all time high during dot com bubble)
strong resistance level at: 1,565.15 set on Oct 09, 2007 (all time high during housing buble before sub prime crisis)
Next Support Levels:
strong support level at: 1299.84 set by 200 Days EMA.
strong support level at 1189.40 set on Nov 26, 2010
strong support level at 1119.46 set on Aug 08, 2011
minor support level at 1064.59 set on Aug 27, 2010
strong support level at 1022.58 set on Jul 02, 2010
strong support level at 1036.18 set on Oct 30, 2009
strong support level at 946.21 set on Jun 12, 2009
strong support level at 827.37 set on Sep 27, 2002
strong support level at 683.38 set on Mar 06, 2009
strong support level at 638.73 set on Jul 19, 1996 - Might see this number again when completing double dip bottom
Posted on Jul 22, 2012
|
|