S&P 500 Technical Forecast Weekly Starting September 05, 2011 - Continue Betting on Volatility and Shorting on US Treasuries
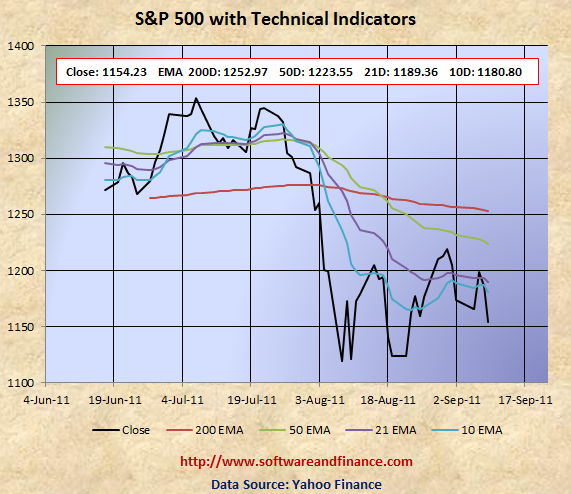
Sep 09, 2011 - S&P 500 closed today at 1154.23 which is about 20 points down compared to last week close of 1173.97 on Sep 02, 2011. S&P 500 experienced a swing of about 64 points between 1140.13 and 1204.40 in the holiday shortened week.
To watch S&P 500 Index in google finance, visit the following link:
S&P 500 Index in Google Finance
To watch S&P 500 Index in yahoo finance, visit the following link:
S&P 500 Index in Yahoo Finance
Last Week Analysis - Anticipation of QE3 because of higher unemployment rate and Euro Zone fear of possible Greece Default
S&P 500 experienced a swing of about 64 points between 1140.13 and 1204.40 in the holiday shortened week. Euro Zone fear of possible Greece Default and disappointment outlook from US Fed Chairman Ben S. Bernanke triggered a huge sell off in the last two trading sessions.
Last Week Low: 1140.13
Last Week High: 1204.40
If you are a long term conservative investors, I have been suggesting to go long on US treasuries in the past couple of weeks. Now it is the time to liquidate all of your long position US treasuriesand consider shorting US Treasuries gradually in the coming weeks with a ladder of order.
The collapse in US Treasury prices are inevitable since even with QE3, Fed will start buying only when the treasury prices are low and front running the Fed is not a good strategy in investment.
You can cover some of your short position you have accumulated so far. Currently dollar is the only safe heaven for long term conservative investors.
For Speculators and Intraday Players - Go long with Hedging and Betting on Volatility
The debt talks, earning season and on going crisis from Euro Zone increased the volatility. Trader bought call options on VIX might have earned huge profit from their trades. Still fundamentally the US market is very week due to unemployment and slumping house prices along with US debt downgrade. Always fundamental wins in the long run.
Only if you are day trader, you can have the two following options:
1. Buy 1X times of put options and 1X time of call option - known as option strangle.
2. Long on stocks with Stop Loss orders or with long put option - known as hedging.
Technical Indicators
10 Days EMA: 1180.80
21 Days EMA: 1189.36
50 Days EMA: 1223.55
200 Days EMA: 1252.97
Next Resistance Levels:
strong resistance level at: 1223 - 1253 set by 50 days and 200 days EMA. Market may retest this level once more to make the upward move in the short term.
strong resistance level at: 1386.95 set on Mar 16, 2007
strong resistance level at: 1433.06 set on Aug 03, 2007
strong resistance level at: 1440.70 set on Nov 23, 2007
strong resistance level at: 1453.55 set on Sep 07, 2007
strong resistance level at: 1,530.23 set on May 30, 2007 (first closing high after dot com bubble)
strong resistance level at: 1,552.87 set on Mar 24, 2000 (all time high during dot com bubble)
strong resistance level at: 1,565.15 set on Oct 09, 2007 (all time high during housing buble before sub prime crisis)
Next Support Levels:
strong support level at 1189.40 set on Nov 26, 2010
minor support level at 1064.59 set on Aug 27, 2010
strong support level at 1022.58 set on Jul 02, 2010
strong support level at 1036.18 set on Oct 30, 2009
strong support level at 946.21 set on Jun 12, 2009
strong support level at 827.37 set on Sep 27, 2002
strong support level at 683.38 set on Mar 06, 2009
strong support level at 638.73 set on Jul 19, 1996 - Might see this number again when completing double dip bottom
Posted on Sep 10, 2011
|
|