S&P 500 Forecast From Oct 17, 2011 - Bear Market Rally Will Collapse and US Long Term Interest Rate have Bottomed (Expected Trading Range: 1090 - 1240)
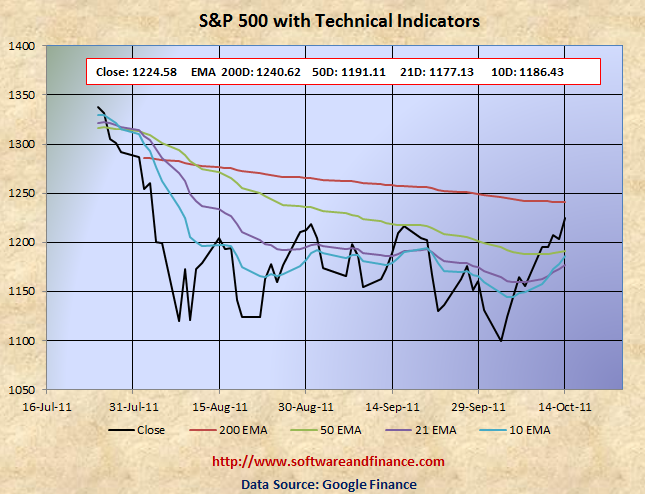
Oct 14, 2011 - S&P 500 closed today at 1224.58 which is 69 points (5.98%) up compared to last week close of 1155.46 on Oct 07, 2011. S&P 500 was trading between between 1158.15 and 1224.61 in the last week.
To watch S&P 500 Index in google finance, visit the following link:
S&P 500 Index in Google Finance
To watch S&P 500 Index in yahoo finance, visit the following link:
S&P 500 Index in Yahoo Finance
Last Week Analysis - Bear Market Rally as US Long Term Interest Rate have Bottomed
S&P 500 gained about 5.98% and had a very good week compared to the last couple of weeks. As the 30 years yield of US treasuries bottomed, many investors started coming out of treasuries and they are not sure of what to do with the money. Consequently they have started invested again in US Stocks. This is the main cause of the last week rally in US Market. Indian markets and other Asian markets just followed US market trends. Note that US long term 30 years interest rate went up by 16.67% from 2.77% on Oct 04, 2011 to 3.22% on Oct 14, 2011. Again stocks are vulnerable of steep pullback.
Note: US Interest Rate Bottom retesting will happen again in the coming months.
Last Week Low: 1158.15
Last Week High: 1224.61
Looking at the chart below clearly indicates the declining 200 days EMA and 50 days EMA. It means that market will tend to go lower in the long term with occasional bear market rally. In this market, buy and hold strategy would fail. We need to follow the key technical support levels and play with swing trading strategies. Swing trading involves high risks when range bound trading completely broken. Betting on volatility with negative bias would yield a lot in this market. Institutional investors are smartly exiting their long and short positions based on the market condition and keep switching their assets. When treasuries are reaching almost a top level, then institutional investors will exit from the treasuries and t-bills and switch back to undervalues banking and finance sector. This is the main cause of the rally in the last 3 trading sessions.
If you are a long term conservative investors, it is the time to hold or cover your short position on US treasuries and consider switching back to US$.
The collapse in US Treasury prices are inevitable since even with QE3, Fed will start buying only when the treasury prices are low and front running the Fed is not a good strategy in investment.
Currently dollar is the only safe heaven for long term conservative investors.
For Speculators and Intraday Players - Betting on Volatility (Option Straddle / Strip)
The debt talks, earning season and on going crisis from Euro Zone increased the volatility. Still fundamentally the US market is very week due to unemployment and slumping house prices along with US debt downgrade. Always fundamental wins in the long run.
Due to last week surge in US long term interest rate, the market may not hold the current level and is getting ready for pullback again.
Only if you are day trader, you can have the two following options:
1. Buy 1X times of (OTM) call options and 2X time of (OTM) put option - known as option strip.
2. Buy 1X time of call and 1X time of put option with the same strike price - known as option straddle.
Note: OTM - means Outside the money.
Technical Indicators
10 Days EMA: 1186.43
21 Days EMA: 1177.13
50 Days EMA: 1191.11
200 Days EMA: 1240.62
Next Resistance Levels:
strong resistance level at: 1240.62 set by 200 days EMA
strong resistance level at: 1386.95 set on Mar 16, 2007
strong resistance level at: 1433.06 set on Aug 03, 2007
strong resistance level at: 1440.70 set on Nov 23, 2007
strong resistance level at: 1453.55 set on Sep 07, 2007
strong resistance level at: 1,530.23 set on May 30, 2007 (first closing high after dot com bubble)
strong resistance level at: 1,552.87 set on Mar 24, 2000 (all time high during dot com bubble)
strong resistance level at: 1,565.15 set on Oct 09, 2007 (all time high during housing buble before sub prime crisis)
Next Support Levels:
minor support level at 1191.11 set by 50 days EMA
strong support level at 1119.46 set on Aug 08, 2011
strong support level at 1189.40 set on Nov 26, 2010
minor support level at 1064.59 set on Aug 27, 2010
strong support level at 1022.58 set on Jul 02, 2010
strong support level at 1036.18 set on Oct 30, 2009
strong support level at 946.21 set on Jun 12, 2009
strong support level at 827.37 set on Sep 27, 2002
strong support level at 683.38 set on Mar 06, 2009
strong support level at 638.73 set on Jul 19, 1996 - Might see this number again when completing double dip bottom
Posted on Oct 15, 2011
|
|