S&P 500 Forecast From April 30, 2012 - Market setting Lower Highs! (Expected Trading Range: 1334 - 1425)
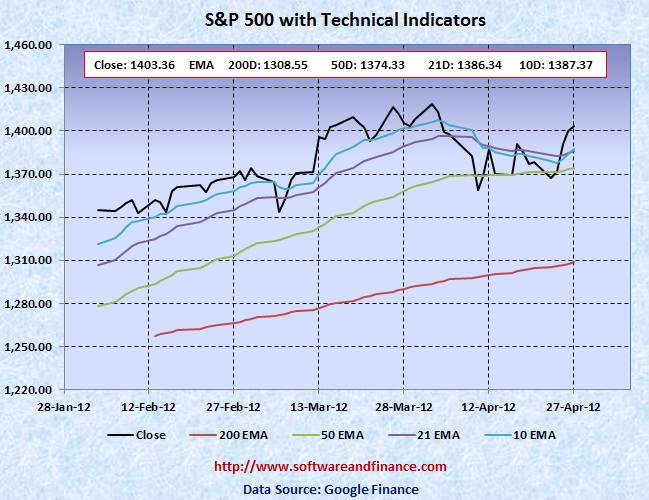
Apr 27, 2012 - S&P 500 closed today at 1403.36 which is about 25 points up compared to last week close of 1378.53 on April 20, 2012. S&P 500 was trading between 1358.79 and 1406.64 which is a swing of 48 points.
To watch S&P 500 Index in google finance, visit the following link:
S&P 500 Index in Google Finance
To watch S&P 500 Index in yahoo finance, visit the following link:
S&P 500 Index in Yahoo Finance
Last Week Analysis - Earning helped to set lower high
The upbeat earning from Amazon and Apples pushed indices up by setting the lower high for them. It is nothing but a part of retesting the technical levels before it moves down. Fed comments after FOMC meeting also helped the market to move up.
Oil prices have been gone up so fast in the last 6 months. During election year, oil prices will be trading at low levels historically due to polictial interest. Besides rising dollar is the key factor now. Market bottom will be seen around election that is where when everything goes down except US$.
FYI - France will hold presidential elections on April 22 and May 6, followed by general elections in June.
US will hold presidential elections on Nov 06, 2012.
With respect to US long term treasury prices, TLT closed today at 117.29 which is 22 cents up for the week compared to last week close of 117.07. US treasury is bit late to good buy now since it bounced a lot this week. But if you are short on US treasuries, you have to liquidate your short position. US treasuries (Ticker: TLT) TLT upside is huge now that is towards 125-130.
Even though market moved up, treasuries prices stayed flat signalling that downside is imminent.
Last Week Low: 1358.79
Last Week High: 1406.64
If you are a long term conservative investors,
1. Stay away from US treasuries since it is too late to short and too early to buy.
2. US$ is only safe heaven. It is another good time to initiate short positions on S&P. Since S&P is trading above its 50 days EMA and 200 days EMA, some people might think that the bull market is back. But it is nothing but another bear market rally. Now stock market is ready for its free fall back to below 1100.
For Speculators and Intraday Players - Short Stocks with Stop Loss Orders and Long Options Strip
CBOE Volatility Index (VIX) moved up strongly in the last week and closed at 16.32. There is still a good chance for rally on VIX, it can go up to 40 in the short run. It is also good idea to take long positions on VIX. Still fundamentally the US market is very week due to unemployment and slumping house prices along with US debt downgrade. Always fundamental wins in the long run.
Only if you are day trader, you can have the following options:
1. Buy 2X OTM put option and 1X OTM call option.
2. Short Stocks and stop loss orders.
3. Short Stocks with long call options
Note: OTM - means Outside the money.
Technical Indicators
10 Days EMA: 1387.37
21 Days EMA: 1386.34
50 Days EMA: 1374.33
200 Days EMA: 1308.55
Next Resistance Levels:
strong resistance level at: 1345.02 set by Jul 22, 2011.
strong resistance level at: 1386.95 set on Mar 16, 2007
strong resistance level at: 1433.06 set on Aug 03, 2007
strong resistance level at: 1440.70 set on Nov 23, 2007
strong resistance level at: 1453.55 set on Sep 07, 2007
strong resistance level at: 1,530.23 set on May 30, 2007 (first closing high after dot com bubble)
strong resistance level at: 1,552.87 set on Mar 24, 2000 (all time high during dot com bubble)
strong resistance level at: 1,565.15 set on Oct 09, 2007 (all time high during housing buble before sub prime crisis)
Next Support Levels:
minor support leval at: 1374.33 set by 50 days EMA
strong support level at: 1308.55 set by 200 Days EMA.
strong support level at 1189.40 set on Nov 26, 2010
strong support level at 1119.46 set on Aug 08, 2011
minor support level at 1064.59 set on Aug 27, 2010
strong support level at 1022.58 set on Jul 02, 2010
strong support level at 1036.18 set on Oct 30, 2009
strong support level at 946.21 set on Jun 12, 2009
strong support level at 827.37 set on Sep 27, 2002
strong support level at 683.38 set on Mar 06, 2009
strong support level at 638.73 set on Jul 19, 1996 - Might see this number again when completing double dip bottom
Posted on Apr 28, 2012
|
|