S&P 500 Forecast From Nov 28, 2011 - S&P to be Volatile and Looking for Direction (Expected Trading Range: 1077 - 1253)
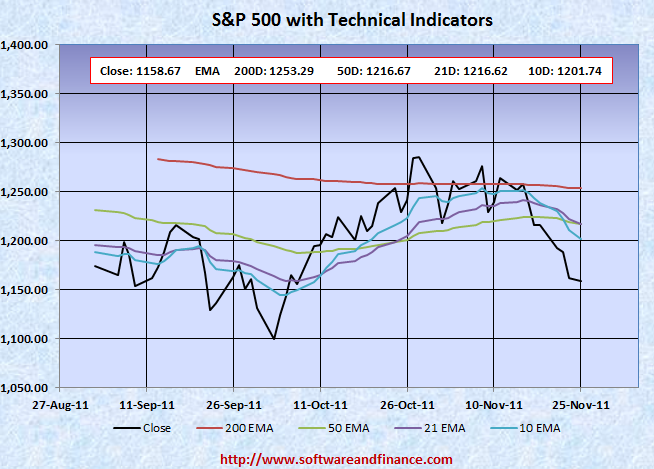
Nov 25, 2011 - S&P 500 closed today at 1158.67 which is 57 points (4.69%) down compared to last week close of 1215.65 on Nov 18, 2011. S&P 500 was trading between between 1215.62 and 1158.66 in the Thanks Giving Holiday Shortened week.
To watch S&P 500 Index in google finance, visit the following link:
S&P 500 Index in Google Finance
To watch S&P 500 Index in yahoo finance, visit the following link:
S&P 500 Index in Yahoo Finance
Last Week Analysis - Selling Continues...
S&P 500 closed 4.69% down for the last week. As per my last week forecast, Market started moving down. You can hold or cover your short positions based on your profit. With respect to US long term treasury prices, TLT closed today at 120.79 with a small gain of 1.2% for the week. US treasury is too early to buy and too late to short. US treasuries (Ticker: TLT) would bottom near 100 - 103 and TLT is a good short position if it moves above 125. Alternatively you can consider buying TMV.
Note: US Interest Rate Bottom retesting will happen again in the coming months.
Last Week Low: 1158.66
Last Week High: 1215.62
If you are a long term conservative investors,
1. It is the time to short US treasuries on long term. TLT closed today at 120.79 and it would bottom near 100 - 103. If you are on the profit side, you can liquidate your long position. You can initiate long position ono US treasuries, when it started moving below 105 gradually.
2. US Treasury prices started moving up with retesting the interest rate bottom. Still Fed Fed would on QE3 announcement until the yieds are very high and the prices are very low. Front running the Fed is not a good strategy in investment.
3. US$ is only safe heaven. You can invest little portion of your investment on bear funds like TMV etc. Currently Market is looking for direction. If it goes down further, then you can take long positions on stocks - FAS, QLD, etc.
For Speculators and Intraday Players - Long Market with stop loss or long on long dated OTM Call options
CBOE Volatility Index (VIX) trading started moving up and closed at 34.47. There is a little room to rally on VIX, it can go up to 40 in the short run. Still fundamentally the US market is very week due to unemployment and slumping house prices along with US debt downgrade. Always fundamental wins in the long run.
Only if you are day trader, you can have the following options:
1. Buy long dated (OTM) call option - at least one month expiry time.
2. Long the market with stop loss order
3. Long the market with long call option (Hedging)
Note: OTM - means Outside the money.
Technical Indicators
10 Days EMA: 1201.74
21 Days EMA: 1216.62
50 Days EMA: 1216.67
200 Days EMA: 1253.29
Next Resistance Levels:
strong resistance level at: 1253.29 set by 200 Days EMA.
strong resistance level at: 1386.95 set on Mar 16, 2007
strong resistance level at: 1433.06 set on Aug 03, 2007
strong resistance level at: 1440.70 set on Nov 23, 2007
strong resistance level at: 1453.55 set on Sep 07, 2007
strong resistance level at: 1,530.23 set on May 30, 2007 (first closing high after dot com bubble)
strong resistance level at: 1,552.87 set on Mar 24, 2000 (all time high during dot com bubble)
strong resistance level at: 1,565.15 set on Oct 09, 2007 (all time high during housing buble before sub prime crisis)
Next Support Levels:
strong support level at 1189.40 set on Nov 26, 2010
strong support level at 1119.46 set on Aug 08, 2011
minor support level at 1064.59 set on Aug 27, 2010
strong support level at 1022.58 set on Jul 02, 2010
strong support level at 1036.18 set on Oct 30, 2009
strong support level at 946.21 set on Jun 12, 2009
strong support level at 827.37 set on Sep 27, 2002
strong support level at 683.38 set on Mar 06, 2009
strong support level at 638.73 set on Jul 19, 1996 - Might see this number again when completing double dip bottom
Posted on Nov 26, 2011
|
|