S&P 500 Forecast From May 28, 2012 - Market Rally to contine, Facebook option trading eyed! (Expected Trading Range: 1290 - 1356)
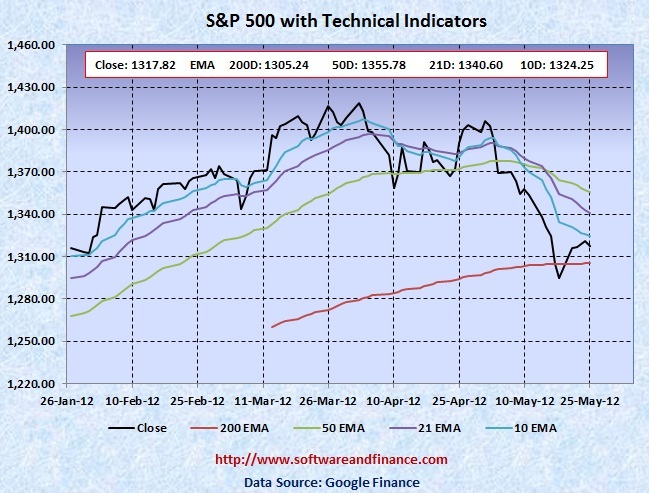
May 25, 2012 - S&P 500 closed today at 1317.82 which is about 23 points up compared to last week close of 1295.12 on May 18, 2012. S&P 500 was trading between 1295.73 and 1328.49 which is a swing of 33 points. Note that US Market is closed on May 28, 2012 for Memorial Day.
To watch S&P 500 Index in google finance, visit the following link:
S&P 500 Index in Google Finance
To watch S&P 500 Index in yahoo finance, visit the following link:
S&P 500 Index in Yahoo Finance
Last Week Analysis - Market regained its 200 days EMA
Every day news coming out from Euro Zone created a huge panic in the market. Facebook IPO is overhyped in the market. The current P/E ratio is 102.1X which is huge for social media company. If Facebook did not do well in the next quarter, then it will erase at least 50% of its value and will put FB to trade near teens. However Market tried to regain its support level of 200 days EMA and confirms that it can rally upto 1356 before it continues downturn.
US will hold presidential elections on Nov 06, 2012.
With respect to US long term treasury prices, TLT closed today at 123.40 which is a doube top of its 52 weeks high point of 125.03. It is the perfect time to initate short position US treasuries. The upside is very much limited on US treasuries and downside is huge.
Last Week Low: 1295.73
Last Week High: 1328.49
If you are a medium or long term conservative investors,
1. Initate short position on US treasuries.
2. Since S&P 500 went below its 200 days EMA after a long time, the stock market rally is imminet. So you can go ahead cover all of your short position and initiate long position on US equities.
For Speculators and Intraday Players - Long Stocks with Stop Loss Orders and Long Options Strap
CBOE Volatility Index (VIX) closed today at 21.76 today. Before VIX reaches 40, it has to go down first before it moves up. It is also good idea to liquidate your long positions on VIX. Still fundamentally the US market is very week due to unemployment and slumping house prices along with US debt downgrade. Always fundamental wins in the long run.
Only if you are day trader, you can have the following options:
1. Buy 2X OTM call option and 1X OTM put option.
2. Long Stocks and stop loss orders.
3. Long Stocks with long put options
Note: OTM - means Outside the money.
Technical Indicators
10 Days EMA: 1324.25
21 Days EMA: 1340.60
50 Days EMA: 1355.78
200 Days EMA: 1305.24
Next Resistance Levels:
strong resistance level at: 1345.02 set by Jul 22, 2011.
strong resistance level at: 1355.78 set by 50 days EMA.
strong resistance level at: 1386.95 set on Mar 16, 2007
strong resistance level at: 1433.06 set on Aug 03, 2007
strong resistance level at: 1440.70 set on Nov 23, 2007
strong resistance level at: 1453.55 set on Sep 07, 2007
strong resistance level at: 1,530.23 set on May 30, 2007 (first closing high after dot com bubble)
strong resistance level at: 1,552.87 set on Mar 24, 2000 (all time high during dot com bubble)
strong resistance level at: 1,565.15 set on Oct 09, 2007 (all time high during housing buble before sub prime crisis)
Next Support Levels:
strong support level at: 1302.24 set by 200 Days EMA.
strong support level at 1189.40 set on Nov 26, 2010
strong support level at 1119.46 set on Aug 08, 2011
minor support level at 1064.59 set on Aug 27, 2010
strong support level at 1022.58 set on Jul 02, 2010
strong support level at 1036.18 set on Oct 30, 2009
strong support level at 946.21 set on Jun 12, 2009
strong support level at 827.37 set on Sep 27, 2002
strong support level at 683.38 set on Mar 06, 2009
strong support level at 638.73 set on Jul 19, 1996 - Might see this number again when completing double dip bottom
Posted on May 26, 2012
|
|