S&P 500 Forecast From Dec 10, 2012 - Apple Death Cross and Fiscal Cliff! (Expected Trading Range: 1378 - 1429)
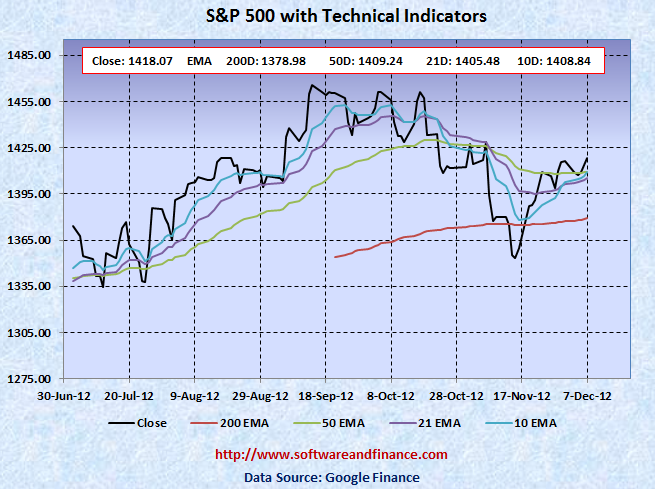
Dec 07, 2012 - S&P 500 closed today at 1418.07 which is near flat compared to last week close of 1416.18 on Nov 30, 2012. S&P 500 was trading between 1398.23 and 1423.73 which is a narrow swing of about 26 points.
To watch S&P 500 Index in MSN finance, visit the following link:
S&P 500 Index in MSN Finance
To watch S&P 500 Index in google finance, visit the following link:
S&P 500 Index in Google Finance
To watch S&P 500 Index in yahoo finance, visit the following link:
S&P 500 Index in Yahoo Finance
Last Week Analysis - Apple Death Cross indicating Free Fall
US Stock Market Indices stayed flat during this week. Unemployment report edged down to 7.7% which is reasonably a good number compared to earlier this year. It shows there is a sign of improvement in the labour market. But Fiscal Cliff and the upcoming interest rate hike might stall the empoyment growth. It is quite natural since the market has gone up so much from May 2009, it has to go down before it moves up again.
After the November monthly employment report released on Friday, US treasuries lead its sell off since the long waited fear of increasing the Fed Interest Rate might happen as early as mid of next year. TLT closed today at 124.43 compared to the last week close of 124.79. TLT reached its all time high point of 132.21 on July 25, 2012. Until the fiscal cliff is cleared, that can happen only by end of this month, TLT will have to stay in the range bound. Any positive news for tax payers can lead to major sell off in US treasuries. It is safe to get out of US Treasuries, if you are on the profit side. Not the downside looks huge compared to upside.
Last Week Low: 1398.23
Last Week High: 1423.73
If you are a medium or long term conservative investors,
1. Initate short position on US treasuries.
2. Wait for the market correct and take long positions on high dividend stocks, especially which market cap is huge and P/E ration is less than 20.
For Speculators and Intraday Players - Volatility on Bond Market
CBOE Volatility Index (VIX) closed today at 15.90 which is almost flat compared to the last week close of over 15.87. Now the market is not showing any fear compared to post election, but still VIX is going to make a powerful upmove Now everyone is watching on Fiscal Cliff that can contribute a significant move on bond and equities market. Until this is cleared by congress end of this year, market will trade in range bound.
Only if you are day trader, you can have the following options:
1. Buy 1X OTM call option and 1X OTM put option on Equities - Long Strangle (Make sure to trade for Jan 18 expiry)
2. Buy 1X OTM call option and 1X OTM put option on US Treasuries - Long Strangle (Make sure to trade for Jan 18 expiry)
Note: OTM - means Outside the money.
Technical Indicators
Next Resistance Levels:
strong resistance level at: 1433.06 set on Aug 03, 2007
strong resistance level at: 1440.70 set on Nov 23, 2007
strong resistance level at: 1453.55 set on Sep 07, 2007
strong resistance level at: 1500 - crazy market move
strong resistance level at: 1,530.23 set on May 30, 2007 (first closing high after dot com bubble)
strong resistance level at: 1,552.87 set on Mar 24, 2000 (all time high during dot com bubble)
strong resistance level at: 1,565.15 set on Oct 09, 2007 (all time high during housing buble before sub prime crisis)
Next Support Levels:
strong support level at: 1409.24 set 50 Days EMA.
strong support level at: 1378.98 set by 200 Days EMA.
strong support level at 1189.40 set on Nov 26, 2010
strong support level at 1119.46 set on Aug 08, 2011
minor support level at 1064.59 set on Aug 27, 2010
strong support level at 1022.58 set on Jul 02, 2010
strong support level at 1036.18 set on Oct 30, 2009
strong support level at 946.21 set on Jun 12, 2009
strong support level at 827.37 set on Sep 27, 2002
strong support level at 683.38 set on Mar 06, 2009
strong support level at 638.73 set on Jul 19, 1996 - Might see this number again when completing double dip bottom.
Posted on Dec 08, 2012
|
|