S&P 500 Technical Forecast Weekly Starting August 29, 2011 - Market is consolidating at current levels for a big rally
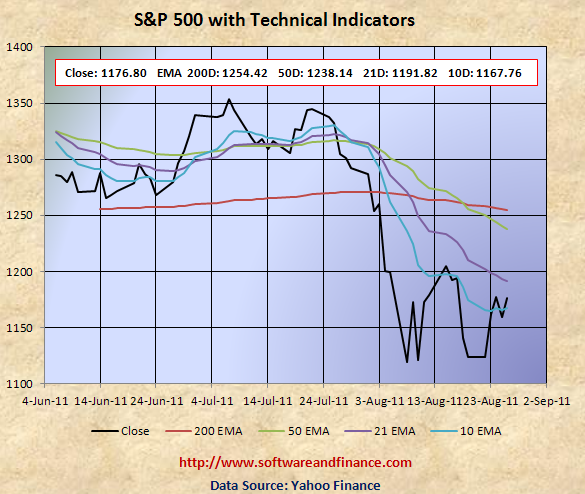
August 26, 2011 - S&P 500 closed today at 1176.80 which is about 53 points up compared to last week close of 1123.53 on August 19, 2011.
To watch S&P 500 Index in google finance, visit the following link:
S&P 500 Index in Google Finance
To watch S&P 500 Index in yahoo finance, visit the following link:
S&P 500 Index in Yahoo Finance
Last Week Analysis
As per earlier last week analysis, S&P 500 started moving in a postive direction in the short term.
Last Week Low: 1295.92
Last Week High: 1347.00
If you are a long term conservative investors, I have been suggesting to go long on US treasuries in the past couple of weeks. Now it is the time to liquidate some percentage of your long US treasuries position and consider moving of high yield dividend paying stocks. Even though more correction is ahead of us, there would be a short term rally from oversold condition.
You can cover some of your short position you have accumulated so far. Currently dollar is the only safe heaven for long term conservative investors.
For Speculators and Intraday Players - Go long with Hedging - Option strap
The debt talks, earning season and on going crisis from Euro Zone increased the volatility. Trader bought call options on VIX might have earned huge profit from their trades. Still fundamentally the US market is very week due to unemployment and slumping house prices along with US debt downgrade. Always fundamental wins in the long run.
Only if you are day trader, you can have the following two options:
1. Long on the market and hedge using long put options - known as long position with put hedge.
2. Buy 1X times of put options and 2X time of call option - known as option strap.
Technical Indicators
10 Days EMA 1167.76
21 Days EMA 1191.82
50 Days EMA 1238.14
200 Days EMA 1254.42
Next Resistance Levels:
strong resistance level at: 1238 - 1255 set by 50 days and 200 days EMA. Market may retest this level once more to make the upward move in the short term.
strong resistance level at: 1386.95 set on Mar 16, 2007
strong resistance level at: 1433.06 set on Aug 03, 2007
strong resistance level at: 1440.70 set on Nov 23, 2007
strong resistance level at: 1453.55 set on Sep 07, 2007
strong resistance level at: 1,530.23 set on May 30, 2007 (first closing high after dot com bubble)
strong resistance level at: 1,552.87 set on Mar 24, 2000 (all time high during dot com bubble)
strong resistance level at: 1,565.15 set on Oct 09, 2007 (all time high during housing buble before sub prime crisis)
Next Support Levels:
strong support level at 1189.40 set on Nov 26, 2010
minor support level at 1064.59 set on Aug 27, 2010
strong support level at 1022.58 set on Jul 02, 2010
strong support level at 1036.18 set on Oct 30, 2009
strong support level at 946.21 set on Jun 12, 2009
strong support level at 827.37 set on Sep 27, 2002
strong support level at 683.38 set on Mar 06, 2009
strong support level at 638.73 set on Jul 19, 1996 - Might see this number again when completing double dip bottom
Posted on August 28, 2011
|
|