S&P 500 Forecast From Nov 12, 2012 - Market Indices Retesting 200 days EMA with Fiscal Cliff (Expected Trading Range: 1338 - 1421)
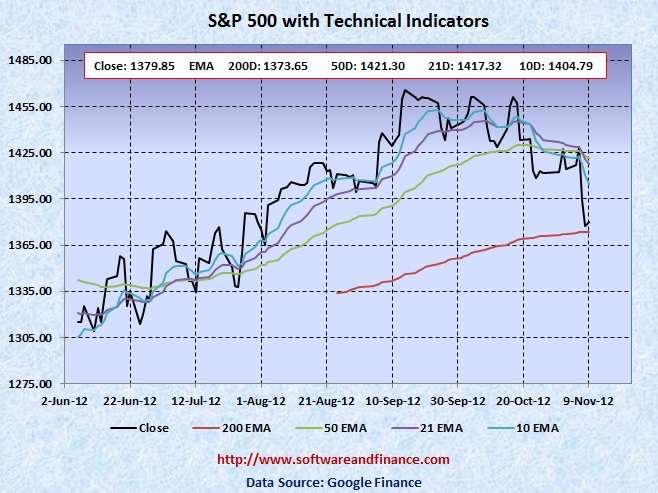
Nov 09, 2012 - S&P 500 closed today at 1379.85 which is about 34 points down compared to last week close of 1414.20 on Nov 02, 2012. S&P 500 was trading between 1373.03 and 1433.38 which is a swing of about 60 points.
To watch S&P 500 Index in MSN finance, visit the following link:
S&P 500 Index in MSN Finance
To watch S&P 500 Index in google finance, visit the following link:
S&P 500 Index in Google Finance
To watch S&P 500 Index in yahoo finance, visit the following link:
S&P 500 Index in Yahoo Finance
Last Week Analysis - Fiscal Cliff is in Focus after President Obama Reelected
Market rallied on the election day Nov 6, 2012 but as soon as the results came out it started moving south because of fiscal cliff. Bush era of tax cut expires by end of this year. President Obama reiterates that taxes on the wealthy is mandatory along with incrasing taxes on capital gains and dividends. The good news is market came out of range bound trading after abouit 3 months.
Since equities started selling off, US long term treasury prices enjoyed a nice bounce. TLT closed today at 125.98 which is $ 3.71 up from the last week close of 122.27. TLT reached its all time high point of 132.21 on July 25, 2012. In the short time, TLT may make a siginificant upward move. So if you are trading on US treasuries in the short term, it is a good time to take long position on US treasuries.
Last Week Low: 1373.03
Last Week High: 1433.38
If you are a medium or long term conservative investors,
1. Initate short position on US treasuries.
2. Liquidate your long positions on Stocks and convert them to cash (US$)
For Speculators and Intraday Players - Bet on Volatility
CBOE Volatility Index (VIX) closed over 18 which is a little gain compared to the last week close of 17.59. Now the market is showing some fear compared to the earlier weeks, but still VIX is going to make a powerful upmove Since fundamentally the US market is very week due to unemployment and slumping house prices along with US debt downgrade. Always fundamental wins in the long run. You can consider taking long positios on VIX also.
Only if you are day trader, you can have the following options:
1. Buy 1X OTM call option and 2X OTM put option - Long Strip.
2. Long Stocks and stop loss orders
3. Long Stocks with long put options
Note: OTM - means Outside the money.
Technical Indicators
Next Resistance Levels:
strong resistance level at: 1421.30 set 50 Days EMA.
strong resistance level at: 1433.06 set on Aug 03, 2007
strong resistance level at: 1440.70 set on Nov 23, 2007
strong resistance level at: 1453.55 set on Sep 07, 2007
strong resistance level at: 1500 - crazy market move
strong resistance level at: 1,530.23 set on May 30, 2007 (first closing high after dot com bubble)
strong resistance level at: 1,552.87 set on Mar 24, 2000 (all time high during dot com bubble)
strong resistance level at: 1,565.15 set on Oct 09, 2007 (all time high during housing buble before sub prime crisis)
Next Support Levels:
strong support level at: 1373.65 set by 200 Days EMA.
strong support level at 1189.40 set on Nov 26, 2010
strong support level at 1119.46 set on Aug 08, 2011
minor support level at 1064.59 set on Aug 27, 2010
strong support level at 1022.58 set on Jul 02, 2010
strong support level at 1036.18 set on Oct 30, 2009
strong support level at 946.21 set on Jun 12, 2009
strong support level at 827.37 set on Sep 27, 2002
strong support level at 683.38 set on Mar 06, 2009
strong support level at 638.73 set on Jul 19, 1996 - Might see this number again when completing double dip bottom.
Posted on Nov 11, 2012
|
|