Gold Investments
Here are my recents postings on Gold Investments.
-
Gold Investments
Gold Prices To reach 2000 US$ per Troy Ounce in 2014
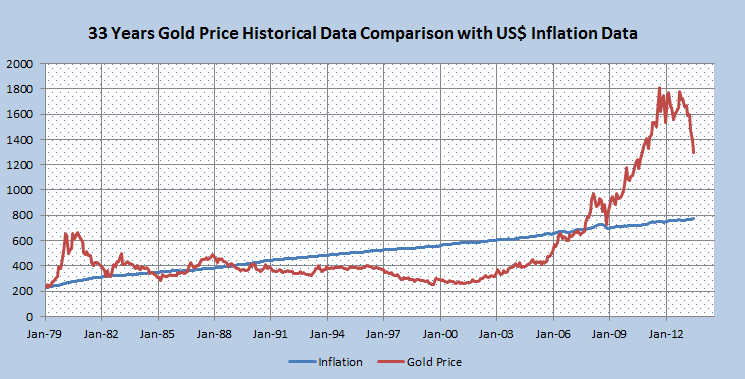
Gold has its worst year of 2013 compared to last the decade. A simple theory is how fast it came down, the same speed it will go up. By ignoring this face, by looking at the production cost statistics from gold miners, it ranges around 1250 US$ per troy ounce. If Gold prices falls below 1200 and stays for a while, miners will suffer a great loss which in turn will reduce their production capacity. When production capacity goes down, there will be strong supply shortage of gold. Since there is strong physical and investment demand for Gold in the entire world, supply shortage will push up the price like anything which I could anticipate Gold price can reach easily 2000 US$ by end of this year in 2014.
Gold is a buy between 1000 to 1300 USD per ounce
June 27, 2013 Gold Futures Closed today at 1211.60 US$. It is the price for one ounce of 24 carrot Gold. Gold Prices peaked just above 1800 US$ during Sep 2011. Today's closing price is about 30% drop from the peak. Currently the question is how much gold price can move down? For that we need to compare with the fair value of gold price compared inflation.
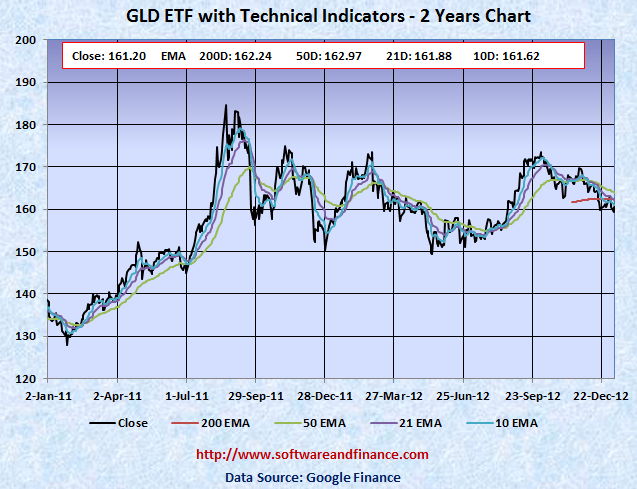
May 04, 2013 - The GLD ETF Closed at 142.09 on NYSE ARCA. It is rougly equivalient to 1420.09 US$ per one ounce of gold. It reached a high point of 174.07 on October 04, 2012. It is down by 18.41 % from the recent peak today. It did also entered into bear market territory 130.51 on April 15, 2013. This is 25% down from the recent peak. May 04, 2013 - The GLD ETF Closed at 142.09 on NYSE ARCA. It is rougly equivalient to 1420.09 US$ per one ounce of gold. It reached a high point of 174.07 on October 04, 2012. It is down by 18.41 % from the recent peak today. It did also entered into bear market territory 130.51 on April 15, 2013. This is 25% down from the recent peak. Gold Price Forecast For 2013 - Gold Nearing Death Cross Jan 31, 2013 - The Gold ETF (GLD) closed today at 161.20. The GLD ETF is trading around it strong support level of 200 days EMA and 50 days EMA. Currently the difference between 200 days EMA (162.25) and 50 days EMA (162.97) for GLD price ETF is only in pennies. In a downward trend of gold prices, it indicates death cross for gold and it will accelerate selling pressure on gold. Gold Price Forecast for Year 2012
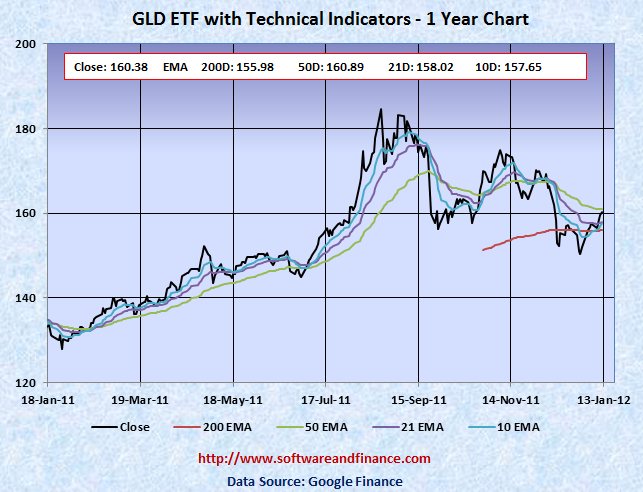
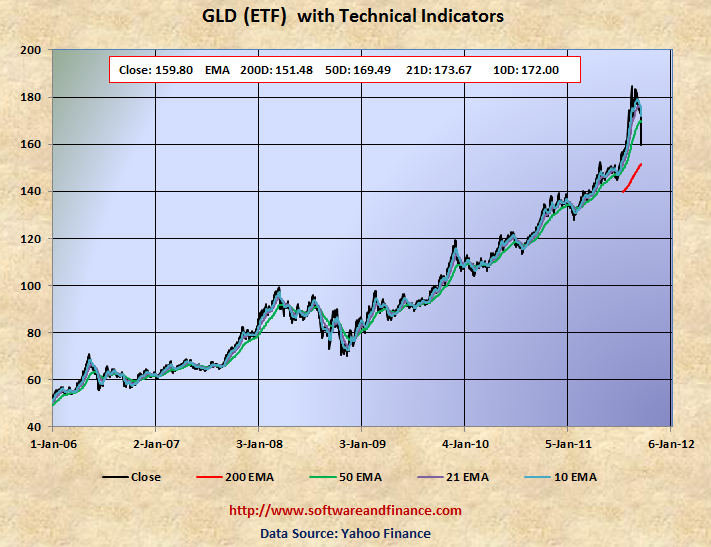
Jan 12, 2012 - The exchange traded fund (GLD) closed today 160.38. Currently Gold prices are trading between its 200 days EMA and 50 days EMA. The convergence of 200 days EMA and 50 days EMA shows that Gold prices are stable in the last 4 months and they are most likely in the topping process. Gold and Silver Prices Crashing While Inflation Starts! Sep 23, 2011 - The exchange traded fund (GLD) closed today 159.80 which is about 16% down from its 52 week high of 185.85 set on Sep 06, 2011. That means with in 3 weeks, gold prices crashed by more than 16%. So far gold has been rallying for couple of months with the anticipation of inflation. When actual inflation is about to happen, gold prices started crahsing with stronger greenback. The 5 year chart of gold price (GLD) is given below:
Gold and Silver Prices testing its 50 and 200 days EMA
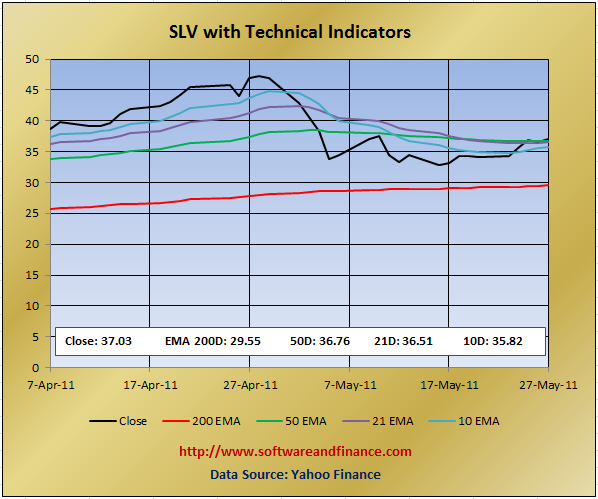
May 29, 2011 - With reference to my earlier article on Gold Silver Burst in Summer 2011, Silver prices collapsed on first two weeks of May. The exchange traded fund SLV holding just above its 10, 21 and 50 days EMA ahead of long weekend. Look at the following chart:
Gold and Silver Bubble to Burst in Summer 2011
May 01, 2011 - As negative sentiment towards US dollar increases, both gold and silver are currently experiencing a bubble. Gold futures trading above 1500 US$ per ounce and Silver Futures trading well above 45 in late April must burst with panic buying and short covering in US dollar.
Gold Price Forecast Feb 2011
Feb 17, 2011 Gold Futures closed today at US$ 1385.80 per ounce and set its annual high of 1432.50 on Dec 07, 2010. Gold Futures are trading well above its 200 days moving average of 1303.873 and 50 days moving average of 1362.402. Jan 28, 2011 Gold Futures failed to touch its support level of 200 days EMA and marked a low on that day at $ 1309.099 and on the same day it rallied up to $ 40.00.
When is the Right Time to buy Gold?
Dec 27, 210 - Historically Gold is considered as international currency and safe heaven as it will not loose its value like currency. From investment perspective, when people are panic over greenback or euro or rupees, then they will switch to Gold. Majority of portfolio managers will have gold as one of their position as it helps them for liquidity when they are in margin calls.
Excellent Gold buying opportunities will not lost more than a couple of weeks, perhaps days. If we miss it, then we may have to wait for years, even sometimes decades to get gold with good bargained price. As gold prices will not get corrected easily as people will almost never loose their confidence in gold and many people will think gold price can continue to go higher.
Gold Fever Needs Treatment..!
Sep 19, 2010 - Gold reached its all time high of US$1275.6 on 17 Sep 2010. There will not be any surprise of resetting this all time high in the next coming weeks. However based of curreny deflationary pressure and increasing US $value among other currencies, this gold fever needs immediate treatment, perhaps will start in a couple of weeks and definitely not months.
Gold is not yet safe to buy!
Jul 10, 2010 - With reference to my earlier article on Gold prices are going down? dated May 16, 2010, I have mentioned Gold reached its high at $1249.70 on May 12. After this point gold is trading in a range bound session for the last couple of months. It did reset its annual high to $1266.50 on June 21st even it closed at $1240.70 for the same day. The intraday swing on the day is roughly 3% and it confirms it double top pattern. It made one more attempt to reset its peak on June 28, 2010 and then plunged. As of July 9, 2010, Gold Futures closed at $1209.80 down by 4.48% from its annual high.
Gold prices are going down?
May 16, 2010 - When stock market starts to go down, people will jump to safe heaven like Dollar, Gold or US treasures. On May 12, Gold prices reached its high at 1249.70 USD per ounce. GLD is an open ended exchange traded fund and it holds the physical Gold. This fund can issue shares for deposits of Gold and vice versa. GLD is good investment and can be considered as a paper gold. It is easy to buy and sell, because of its high liquidity.
|
|