Gold Price Forecast for Year 2012
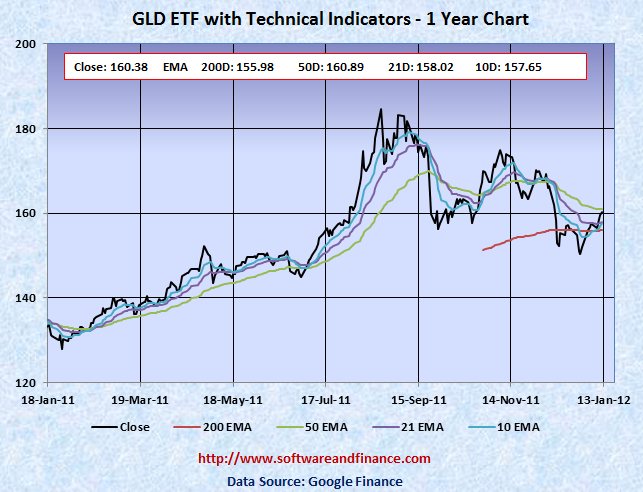
Jan 12, 2012 - The exchange traded fund (GLD) closed today 160.38. Currently Gold prices are trading between its 200 days EMA and 50 days EMA. The convergence of 200 days EMA and 50 days EMA shows that Gold prices are stable in the last 4 months and they are most likely in the topping process.
When GLD price moves below 150, it loses the support level completely and then going forward 200 days EMA would act as a strong resistance level. This is what going to happen with stronger greenback in the US presidential election year.
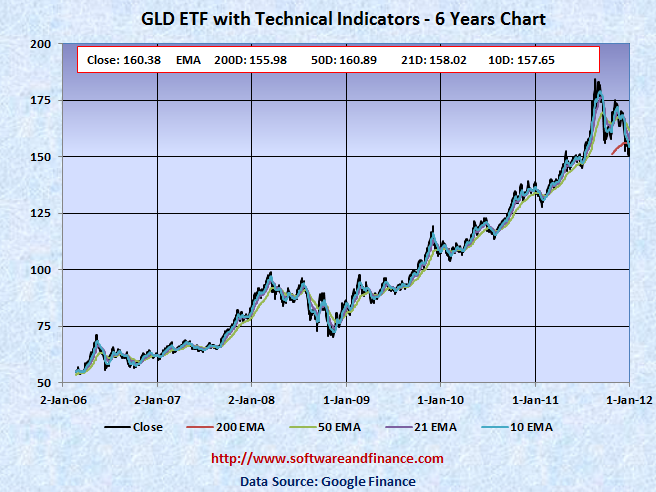
Gold prices have been rallied by 44% when GLD was trading around US$ 90.00 during Jan 2008. In the same time, inflation was up only 7.17%. With respect to the inflation, GLD prices must go below 100 in this year with stronger greenback. As soon as it moves below 100, it is a good time to invest in GLD. Until then stay away from safe heaven.
The one year chart of gold price (GLD) is given below:
The 6 year chart of gold price (GLD) is given below:
Data Sources:
Posted on Jan 12, 2012
|
|