Visual C++ - Debugging Techniques
Debugging skills are very important as a part of software development. Let it be any code if you develop, you may have to debug to go through the program flow in many cases for checking the logic, unit testing, identify the crash, memory leaks and etc.
You may need to know the following things for debugging your code efficiently.
This is very important step as a part of debug configuration. This option will generate the .PDB (Program Database Files) and it will be placed along with the location of your application EXE or DLL. It is generated from the source code and it has a collection all symbols, name and line number of the file. When a program is running in debug mode, visual studio debugger will load the information from the .PDB file. In case, if it could not find the .PDB file, it will prompt you to specify the .PDB file. If it is not specified, then you will see the debug code in a nice(!) assembly language which often you can not understand.
To generate PDB files, select the option Debug Information Format to "Program Database /Zi option" for debug mode. Note this option is often selected manually by programmers in release mode also. If a program crashes in the client machine where you will not have visual studio installed, then WinDbg (Debugging Tools for Windows) can be used to catch the exception and we can the get the stack view using .PDB file. Because of this reason, PDB files are generated in release version also and is shipped along with the package. It basically depends on the company policy to release .PDB file along with the package or not.
It discusses about Maximize Speed and inline macro expansion for debug and release mode.
It is another important factor in debug version. In debug version _DEBUG is defined and in release version NDEBUG is defined. Based on this macro, all visual studio include files will include either debug or release section of the code.
A typical example in MFC would be using DEBUG_NEW in place of new for allocating memory. If _DEBUG is defined then it will have information about the file and line number of the place where memory is being allocated. It is used to identify the memory leaks in debug mode with out using any tools like Rational Purify.
ifdef _DEBUG
#define DEBUG_NEW new( _NORMAL_BLOCK, __FILE__, __LINE__)
#else
#define DEBUG_NEW
#endif
Usually programmer will not change this option and they will use _DEBUG for debug version and NDEBUG for release version.
Selecting the Appropriate Run Time Library
Here are the four configuration you may need to know
Multi-threaded (/MT) - Application EXE in release mode
Multi-threaded Debug (/MTd) - Application EXE in debug mode
Multi-threaded DLL (/MD) - Application DLL in release mode
Multi-threaded Debug DLL (/MDd) - Application DLL in debug mode
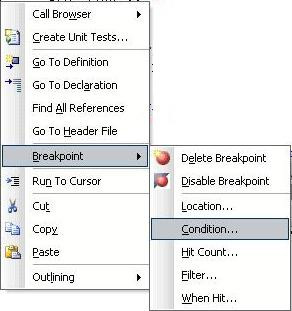
From visual studio, simply press F5 key or Debug->Start Debugging to start the application in debug mode. You can set a break point in your source code. Also you will have an option to set a conditional break point also as shown in the figure below.
The recent versions of Visual Studio provides easier option to debug multiple DLLs that are loaded by an application.
Load the DLL project in visual studio and set the desired break points. Now you have two options.
1. You can start the process EXE separately and later you can attach the process to visual studio by Debug menu "Attach to Process".
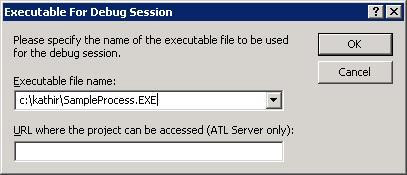
2. you can directly run the debugger by pressing F5 key or Debug->Start Debugging. As it is an application DLL, it will prompt you to select the associated process.
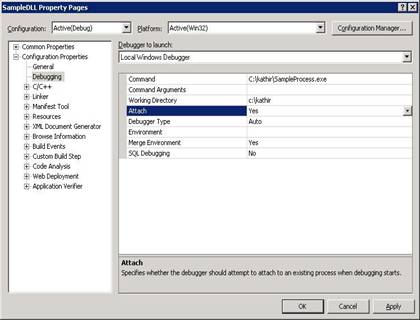
Alternatively you can configure the .EXE in DLL project properties in Debugging tab. You can also specify the Working Directory to start with.
If the selected application does not load your DLL, then you will see your break points gets disabled. When the application completes loading of your DLL, then you will see your break points gets enabled automatically. In case, your linking DLL and EXE is not good, then also you will see break point getting disabled. In this case, do a rebuild on exe and dll and make sure the path are correct.
|
|