Nifty Technical Forecast Weekly Starting August 01, 2011 - Free Fall to next support level 5225
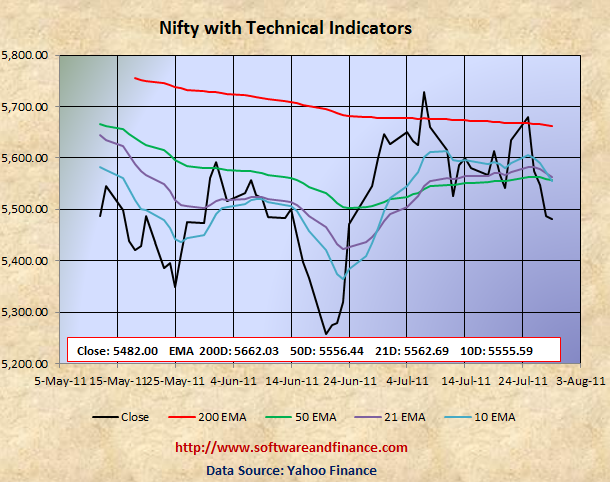
July 22, 2011 - Nifty Closed today at 5482.00 which is about 152 points down from the last week close of 5633.95 on July 22, 2011.
To watch Nifty Index in google finance, visit the following link:
NSE Index in Google Finance
To watch Nifty Index in yahoo finance, visit the following link:
NSE Index in Yahoo Finance
Last Week Analysis
With reference to last week forecast, I have mentioned that "Nifty would be very much unlikely that it will go up again from this point. Chances are more that Nifty will fall back to its 50 days EMA of 5557.18." which came exactly true last week.
Last Week Low: 5,453.95 (free fall to next support level - psychological level of 5400)
Last Week High: 5,702.25 (50 point above its 200 days EMA to confuse novice investors).
Currently nifty broke all of its technical level and it is fundamentally and technically ready to take a free fall to next support level around 5225. It is stay out of the market for the time being for conservative investors. It is too late to liquidate your poistion as well as initiate a short position. Wait for next buying opportunity would be the best option.
If you are a long term conservative investors, then you have to switch your investment strategy and move on the Fixed Income Securities - Govt. Bonds, Fixed Deposit, etc.
Nifty is good to STRONG BUY for conservative investors only it encounters a deep correction which I expect it to go all the way down to 4800 which was set on Feb and May 2010. There might be chance for double dip in Indian Market along with world market correction. With double dip, Nifty is expected to touch 2600 levels set on Oct 2008 and Mar 2009. Wait for some more time to get more clues on "double dip on Nifty"
For Speculators and Intraday Players
If you look at the chart, technically there is no support level for Nifty. It may very well take us to its next support level of around 5400 and 5225? If washington comes up with any surprise debt ceiling deal, it may go up for a day or two.
Again you can follow the same following two stragegy for speculation. Note that in the following two options, long call option is also very important. Because bear market often causes powerful rally compared bull market.
1. Short the market and hedge using long call options - known as short position with call hedge.
2. Buy 2X times of put options and 1X time of call option - known as option strip.
It is very risky to play in this market without hedging. Sudden debacle is more likely any time. Note that if we break 50 days EMA, then there is no support level for Nifty until 5225.80. There might be psychological level support of around 5400.
Technical Indicators
10 days EMA: 5555.59
21 days EMA: 5562.69
50 days EMA: 5556.44
200 days EMA: 5662.03
Next Resistance Levels:
Resistence level at: 5556.44 - 200 days EMA
Resistence level at: 5662.03 - 200 days EMA
Next Support Levels:
Psychological Support level at 5400.00
Strong support level at 5225.80 set on Feb 10, 2011 and Jun 20, 2011
Strong support level at 4806.75 set on May 25, 2010
Strong support level at 4718.00 set on Feb 05, 2010
Strong support level at 4003.90 set on Jul 10, 2009
Strong support level at 2620.10 set on Mar 06, 2009 Will reach here with double dip
Strong support level at 2584.00 set on Oct 24, 2008 Will reach here with double dip
Posted on July 31, 2011
|
|