Nifty Technical Forecast Weekly Starting July 25, 2011 - Short Stocks with Hedging
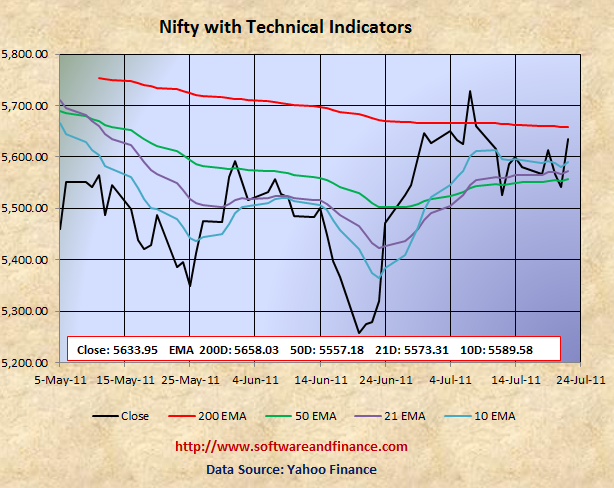
July 15, 2011 - Nifty Closed today at 5633.95 which is about 52 points down from the last week close of 5581.10 on July 15, 2011.
To watch Nifty Index in google finance, visit the following link:
NSE Index in Google Finance
To watch Nifty Index in yahoo finance, visit the following link:
NSE Index in Yahoo Finance
Last Week Analysis
With reference to last week forecast, I have mentioned that Nifty would trading in between its 50 days EMA of 5550.57 and 200 days EMA of 5653.23 which came exactly true last week.
Last Week Low: 5550.95 (exactly 50 days EMA)
Last Week High: 5645.40 (About 8 points below 200 days EMA)
Nifty is touching on its 200 days EMA would be a perfect time to close your existing long positions. If the market goes up for a couple of sessions, then you can initiate short position and accumulate short position gradually in the coming weeks. You can not expect return in the short term. This stratgey is good for long term risk taking investors.
If you are a long term conservative investors, then you have to switch your investment strategy and move on the Fixed Income Securities - Govt. Bonds, Fixed Deposit, etc.
Nifty is good to STRONG BUY for conservative investors only it encounters a deep correction which I expect it to go all the way down to 4800 which was set on Feb and May 2010. There might be chance for double dip in Indian Market along with world market correction. With double dip, Nifty is expected to touch 2600 levels set on Oct 2008 and Mar 2009. Wait for some more time to get more clues on "double dip on Nifty"
For Speculators and Intraday Players
Nifty is perfectly at its strong resistance level and it is very much unlikely that it will go up again from this point. Chances are more that Nifty will fall back to its 50 days EMA of 5557.18. But the big question is whether it can hold this level or can continue fall back to its next support level of around 5400 and 5225? You can play in two ways:
1. Short the market and hedge using long call options - known as short position with call hedge.
2. Buy 2X times of put options and 1X time of call option - known as option strip.
It is very risky to play in this market without hedging. Sudden debacle is more likely any time. Note that if we break 50 days EMA, then there is no support level for Nifty until 5225.80. There might be psychological level support of around 5400.
Technical Indicators
10 days EMA: 5589.58
21 days EMA: 5573.31
50 days EMA: 5557.18
200 days EMA: 5658.03
Next Resistance Levels:
Resistence level at: 5658.03 - 200 days EMA
Next Support Levels:
Minor support level at 5573.31 set by 21 days EMA.
Strong support level at 5557.18 set by 50 days EMA
Strong support level at 5225.80 set on Feb 10, 2011 and Jun 20, 2011
Strong support level at 4806.75 set on May 25, 2010
Strong support level at 4718.00 set on Feb 05, 2010
Strong support level at 4003.90 set on Jul 10, 2009
Strong support level at 2620.10 set on Mar 06, 2009 Will reach here with double dip
Strong support level at 2584.00 set on Oct 24, 2008 Will reach here with double dip
Posted on July 23, 2011
|
|