Visual C++ - Ploting Trigonometric Functions Graph - Sin, Cos and Tan Series
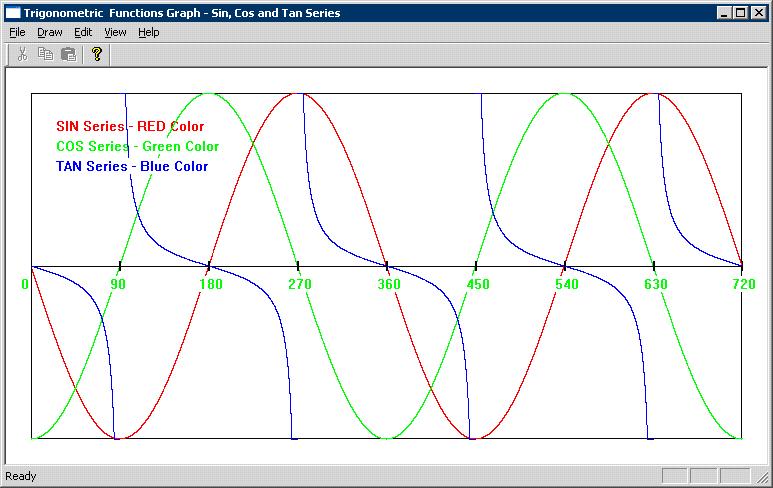
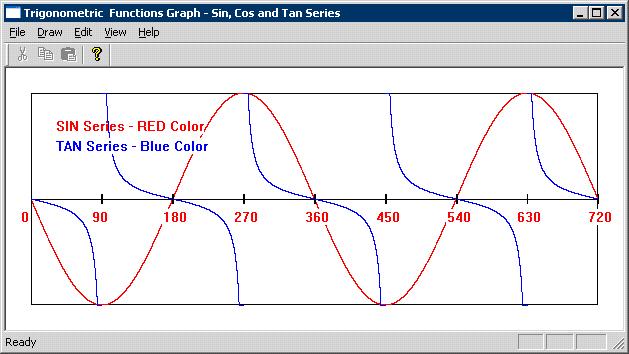
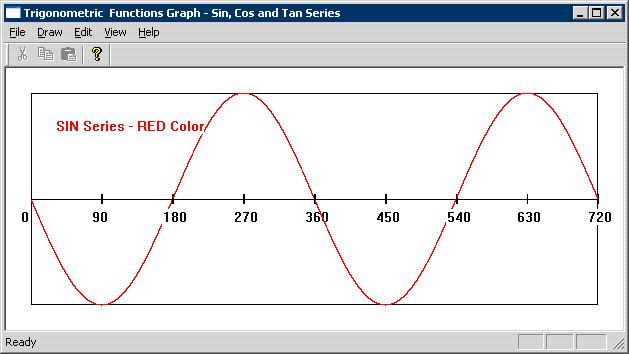
Graphics are always interesting...! Here is simple graphics application that uses CPaintDC in MFC SDI application. It can plot SIN, COS and TAN series. The curve will get adjusted automatically if you resize the application window.
The source code for paint functionality is given below: Look at the sample screen shot and download instructions for VS2005 project source code and run time EXE at the end of this page.
Source Code
void CChildView::OnPaint()
{
CPaintDC dc(this); // device context for painting
CRect rect;
GetClientRect(rect);
int margin = 50;
int width = rect.Width() - margin;
int height = rect.Height() - margin;
//dc.MoveTo(0 + margin / 2, 0 + margin / 2);
//dc.LineTo(0 + margin / 2, height + margin / 2 );
dc.Rectangle(0 + margin / 2, 0 + margin / 2, width + margin / 2, height + margin / 2);
dc.MoveTo(0 + margin / 2, margin / 2 + height / 2);
dc.LineTo(width + margin / 2, margin / 2 + height / 2);
double legendypos = margin;
double legendxpos = margin;
static const double PI = 3.1415926535;
if(m_bPlotSinSeries == true)
{
for(double i = 0; i <= 720.01; i += 0.01)
{
double value = sin(i * PI / 180);
value += 1.0;
int ypos = value / 2 * height + margin / 2;
int xpos = i / 720.0 * width + margin / 2;
dc.SetPixel(xpos, ypos, RGB(255, 0, 0));
if( (int(i) % 90) == 0)
{
dc.MoveTo(xpos, margin / 2 + height / 2 - 5);
dc.LineTo(xpos, margin / 2 + height / 2 + 5);
char buf[32];
sprintf(buf, "%d", int(i));
dc.TextOut(xpos - 10, margin / 2 + height / 2 + 10, buf);
}
}
dc.SetTextColor(RGB(255,0,0));
dc.TextOut(legendxpos, legendypos, "SIN Series - RED Color");
legendypos += 20;
}
if(m_bPlotCosSeries == true)
{
for(double i = 0; i <= 720.01; i += 0.01)
{
double value = cos(i * PI / 180);
value += 1.0;
int ypos = value / 2 * height + margin / 2;
int xpos = i / 720.0 * width + margin / 2;
dc.SetPixel(xpos, ypos, RGB(0, 255, 0));
if( (int(i) % 90) == 0)
{
dc.MoveTo(xpos, margin / 2 + height / 2 - 5);
dc.LineTo(xpos, margin / 2 + height / 2 + 5);
char buf[32];
sprintf(buf, "%d", int(i));
dc.TextOut(xpos - 10, margin / 2 + height / 2 + 10, buf);
}
}
dc.SetTextColor(RGB(0,255,0));
dc.TextOut(legendxpos, legendypos, "COS Series - Green Color");
legendypos += 20;
}
if(m_bPlotTanSeries == true)
{
double factor = 10; // Don't use this factor, it is only for drawing purpose.
for(double i = 0; i <= 720.01; i += 0.01)
{
double value = tan(i * PI / 180);
if(value > factor)
value = factor;
if(value < -factor)
value = -factor;
value += factor;
int ypos = value / (factor * 2) * height + margin / 2;
int xpos = i / 720.0 * width + margin / 2;
dc.SetPixel(xpos, ypos, RGB(0, 0, 255));
if( (int(i) % 90) == 0)
{
dc.MoveTo(xpos, margin / 2 + height / 2 - 5);
dc.LineTo(xpos, margin / 2 + height / 2 + 5);
char buf[32];
sprintf(buf, "%d", int(i));
dc.TextOut(xpos - 10, margin / 2 + height / 2 + 10, buf);
}
}
dc.SetTextColor(RGB(0,0,255));
dc.TextOut(legendxpos, legendypos, "TAN Series - Blue Color");
legendypos += 20;
}
}
Click here to download the VC++ Project Source Code and Executables
Output


|
|