Turbo C++ (TC++) Graphics - Drawing Pie Chart
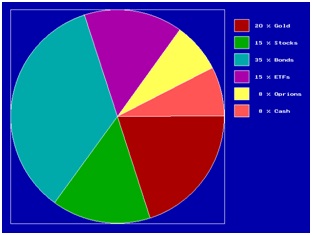
Here is the program for drawing a pie chart. Just fill in the values in PieInfo structure and pie chart will be shown. The program output would be a pie chart showing the portfolio of Gold, Stocks, Bonds, Options, ETFs and Cash with different colors.
It uses the formula xend = x + r cos(angle) and yend = y + r sin(angle).
Source Code
#include <stdio.h>
#include <string.h>
#include <graphics.h>
#include <stdlib.h>
#include <conio.h>
#include <bios.h>
#include <math.h>
#include <iostream.h>
struct PieInfo
{
char desc[128];
double percentage;
int color;
PieInfo() { }
PieInfo(const char*d, double p, int c)
{
strcpy(desc, d);
percentage = p;
color = c;
}
};
extern PieInfo thePieInfo[32];
extern int theSliceCount;
PieInfo thePieInfo[32];
int theSliceCount = 0;
void main()
{
int grd, grm;
detectgraph(&grd,&grm);
initgraph(&grd, &grm, "");
setbkcolor(BLUE);
int margin = 40;
int xmax = getmaxx() - margin;
int ymax = getmaxy() - margin;
if(xmax > ymax)
xmax = ymax;
double xCenter = xmax / 2 + margin / 2;
double yCenter = ymax / 2 + margin / 2;
double radius = ymax / 2;
setcolor(WHITE);
rectangle(margin / 2,margin / 2,xmax + margin / 2,ymax + margin / 2);
circle(xCenter, yCenter, radius);
thePieInfo[0] = PieInfo("Gold", 20, RED);
thePieInfo[1] = PieInfo("Stocks", 15, GREEN);
thePieInfo[2] = PieInfo("Bonds", 35, CYAN);
thePieInfo[3] = PieInfo("ETFs", 15, MAGENTA);
thePieInfo[4] = PieInfo("Oprions", 7.5, YELLOW);
thePieInfo[5] = PieInfo("Cash", 7.5, LIGHTRED);
theSliceCount = 6;
double percent = 0;
static const double PI = 3.1415926535;
for(int i = 0; i < theSliceCount; i++)
{
percent += thePieInfo[i].percentage;
if(percent > 100)
percent = 100;
double angle = percent / 100 * 360;
double x = radius * cos(angle * PI / 180);
double y = radius * sin(angle * PI / 180);
line(xCenter, yCenter, xCenter + x, yCenter + y);
}
radius = radius / 2;
percent = 0;
for(int j = 0; j < theSliceCount; j++)
{
percent += thePieInfo[j].percentage;
if(percent > 100)
percent = 100;
double angle = (percent - thePieInfo[j].percentage / 2) / 100 * 360;
double x = radius * cos(angle * PI / 180);
double y = radius * sin(angle * PI / 180);
setfillstyle(SOLID_FILL,thePieInfo[j].color);
floodfill(xCenter + x, yCenter + y, WHITE);
}
double xpos = xmax + margin;
double ypos = margin;
for(int k = 0; k < theSliceCount; k++)
{
rectangle(xpos, ypos, xpos + 30, ypos + 25);
setfillstyle(SOLID_FILL,thePieInfo[k].color);
floodfill((xpos + xpos + 30) / 2, (ypos + ypos + 25) / 2, WHITE);
char buf[128];
sprintf(buf, "%3.0lf %% %s", thePieInfo[k].percentage, thePieInfo[k].desc);
outtextxy(xpos + 35, ypos + 10, buf);
ypos += 35;
}
getch();
closegraph();
}
Click here to download the source code along with exe file
Output
A pie chart showing the portfolio of Gold, Stocks, Bonds, Options, ETFs and Cash with different colors.
|
|