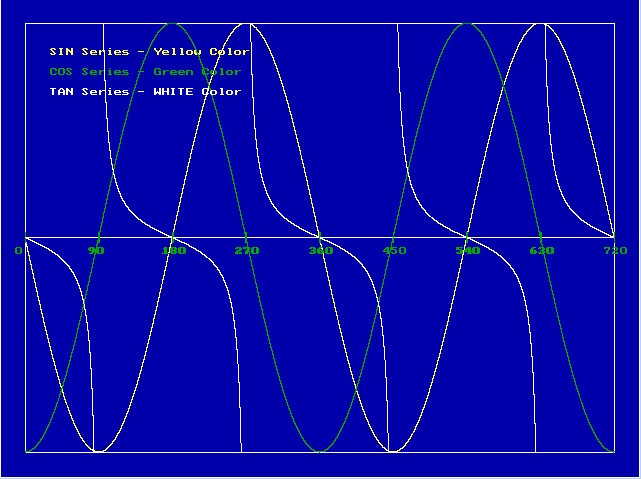
Turbo C Graphics - Plot Sin Cos and Tan Series
Here is the program that can draw the SIN, COS and TAN series. Each series will be drawn in different colors and legends are also shown.
Source Code
#include <stdio.h>
#include <graphics.h>
#include <stdlib.h>
#include <conio.h>
#include <bios.h>
#include <math.h>
void main()
{
int grd, grm;
int xmax, ymax, m;
int margin, width, height;
double legendxpos, legendypos, factor;
static const double PI = 3.1415926535;
int bPlotSinSeries = 1;
int bPlotCosSeries = 1;
int bPlotTanSeries = 1;
char buf[32];
int xpos, ypos;
double i, value;
detectgraph(&grd,&grm);
initgraph(&grd, &grm, "");
setbkcolor(BLUE);
xmax = getmaxx();
ymax = getmaxy();
setcolor(WHITE);
rectangle(0,0,xmax,ymax);
margin = 50;
width = getmaxx() - margin;
height = getmaxy() - margin;
rectangle(0 + margin / 2, 0 + margin / 2, width + margin / 2, height + margin / 2);
line(0 + margin / 2, margin / 2 + height / 2,
width + margin / 2, margin / 2 + height / 2);
legendypos = margin;
legendxpos = margin;
if(bPlotSinSeries == 1)
{
for(i = 0; i <= 720.01; i += 0.01)
{
value = sin(i * PI / 180);
value += 1.0;
ypos = value / 2 * height + margin / 2;
xpos = i / 720.0 * width + margin / 2;
putpixel(xpos, ypos, YELLOW);
m = i;
if( (m % 90) == 0)
{
line(xpos, margin / 2 + height / 2 - 5,
xpos, margin / 2 + height / 2 + 5);
sprintf(buf, "%d", m);
outtextxy(xpos - 10, margin / 2 + height / 2 + 10, buf);
}
}
setcolor(YELLOW);
outtextxy(legendxpos, legendypos, "SIN Series - Yellow Color");
legendypos += 20;
}
if(bPlotCosSeries == 1)
{
for(i = 0; i <= 720.01; i += 0.01)
{
value = cos(i * PI / 180);
value += 1.0;
ypos = value / 2 * height + margin / 2;
xpos = i / 720.0 * width + margin / 2;
putpixel(xpos, ypos, GREEN);
m = i;
if( (m % 90) == 0)
{
line(xpos, margin / 2 + height / 2 - 5,
xpos, margin / 2 + height / 2 + 5);
sprintf(buf, "%d", m);
outtextxy(xpos - 10, margin / 2 + height / 2 + 10, buf);
}
}
setcolor(GREEN);
outtextxy(legendxpos, legendypos, "COS Series - Green Color");
legendypos += 20;
}
if(bPlotTanSeries == 1)
{
factor = 10; // Don't use this factor, it is only for drawing purpose.
for(i = 0; i <= 720.01; i += 0.01)
{
value = tan(i * PI / 180);
if(value > factor)
value = factor;
if(value < -factor)
value = -factor;
value += factor;
ypos = value / (factor * 2) * height + margin / 2;
xpos = i / 720.0 * width + margin / 2;
putpixel(xpos, ypos, WHITE);
m = i;
if( (m % 90) == 0)
{
line(xpos, margin / 2 + height / 2 - 5,
xpos, margin / 2 + height / 2 + 5);
sprintf(buf, "%d", m);
outtextxy(xpos - 10, margin / 2 + height / 2 + 10, buf);
}
}
setcolor(WHITE);
outtextxy(legendxpos, legendypos, "TAN Series - WHITE Color");
legendypos += 20;
}
getch();
closegraph();
}
Click here to download the source code along with exe file
Output
SIN, COS and TAN series will be shown on the screen in different colors.
|
|