Turbo C Graphics - getpixel function
putpixel is the function used to plot of pixel in the given location (x,y) and in the given color. getpixel is the function used to get the pixel color in the specified location .
The possible color values are from 0 - 15 BLACK, BLUE, GREEN, CYAN, RED, MAGENTA, BROWN, LIGHTGRAY, DARKGRAY, LIGHTBLUE, LIGHTGREEN, LIGHTCYAN, LIGHTRED, LIGHTMAGENTA, YELLOW, WHITE and BLINK (128).
Look at the following lines in the sample code.
//draw a circle and a point
circle(cx, cy, 5);
putpixel(cx, cy, WHITE);
// get and display the pixel color
c = getpixel(cx, cy);
sprintf(msg, "Pixel Color: %d", c);
outtextxy(cx - 20, cy + 10, msg);
Back to Turbo C Graphics Index
Source Code
#include <graphics.h>
#include <alloc.h>
#include <stdio.h>
#include <math.h>
#include <conio.h>
#include <dos.h>
#include <stdlib.h>
int InitGraphics()
{
int grd, grm;
int gresult;
// Detect the graphics driver and mode
detectgraph(&grd,&grm);
// initialize the graphics mode with initgraph
initgraph(&grd, &grm, "");
gresult = graphresult();
if(gresult != grOk)
{
printf(grapherrormsg(gresult));
getch();
return -1;
}
// set the background color
setbkcolor(RED);
// set the foreground color
setcolor(WHITE);
// draw a white color border with rectangle
rectangle(0,0,getmaxx(),getmaxy());
return 1;
}
void main()
{
int i, x, y, c;
int left,top,right,bottom;
int sz;
int margin, cx, cy;
char msg[128];
void far *image = 0;
if(InitGraphics() == -1)
return;
margin = 200; // 200 pixel margin
left = margin;
top = margin;
bottom = getmaxy() - margin;
right = getmaxx() - margin;
cx = (left + right) / 2;
cy = (top + bottom) / 2;
setlinestyle(DOTTED_LINE, 0, 1);
rectangle(left, top - 35, right + 35, bottom);
setlinestyle(SOLID_LINE, 0, 1);
sz = imagesize(left, top - 35, right + 35, bottom);
image = farmalloc(sz);
//draw a 3d bar
setfillstyle(SOLID_FILL, BLUE);
bar3d(left, top, right, bottom, 35, 1);
// floodfill with YELLOW color
setfillstyle(SOLID_FILL, YELLOW);
floodfill( (left + right) / 2, top - 2, WHITE);
// floodfill with GREEN color
setfillstyle(SOLID_FILL, GREEN);
floodfill( right + 2, cy, WHITE);
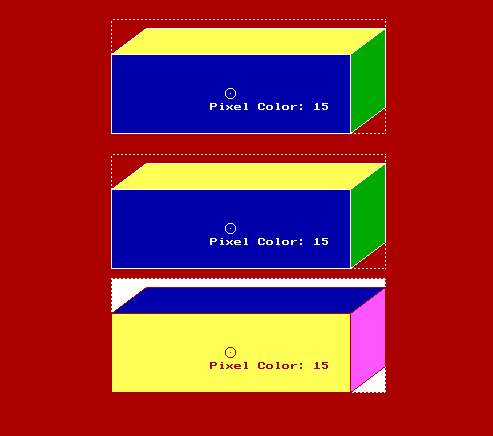
//draw a circle and a point
circle(cx, cy, 5);
putpixel(cx, cy, WHITE);
// get and display the pixel color
c = getpixel(cx, cy);
sprintf(msg, "Pixel Color: %d", c);
outtextxy(cx - 20, cy + 10, msg);
// getimage
getimage(left, top - 35, right + 35, bottom, image);
putimage(left, bottom + 10, image, NOT_PUT);
putimage(left, top - 170, image, COPY_PUT);
getch();
closegraph();
}
Output
|
|