S&P 500 July 2011 Technical Forecast - Bullish breakout will collapse in the coming weeks
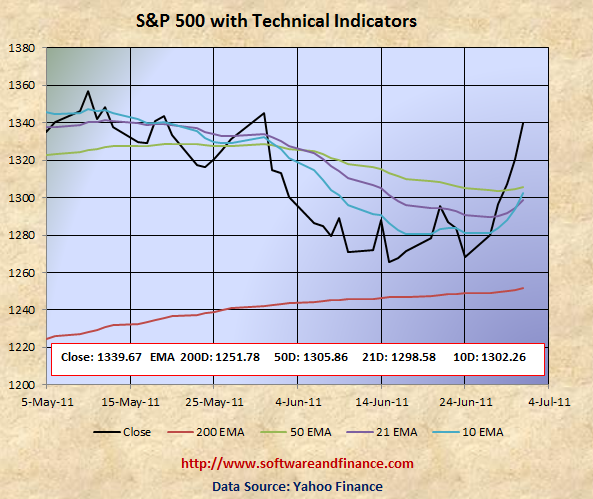
July 01, 2011 - S&P 500 closed today at 1339.67 which is almost flat compared to close of May 31, 2011 at 1345.20.
With reference to my earlier update Wrong Bull Markey would Fail, S&P 500 went much below its 50 days EMA in the first three weeks of June 2011. In the last week of June 2011, again short covering and panic buying pushed index well above that leads the bullish signal on the index. There is no surprise for this rally and is a common situation during bear market.
July Forecast - Bullish breakout will collapse in the coming weeks
Let's look the S&P technical levels in the following chart. S&P 500 is currently above 21 days, 50 days and 200 days EMA. As technicals are still indicating the bull signal, It may try go higher but eventually it will have to come back to 200 days EMA of 1251.78. During the month of June, you can also notice that Gold and Silver commodities not able to set new high and keeps going down gradually.
If you are a long term conservative investors, then you have to switch your investment strategy and move on the Fixed Income Securities - Govt. Bonds, US Long dated Treasuries (TLT), US Dollar (UUP), etc.
If you are a long term risky player in the market, then you can initiate short position and accumulate short position gradually in the coming weeks. You can not expect return in the short term.
Only if you are day trader, you have to follow swing strategies. It is ok to bet on the volatility by betting either side (long and short) on the market.
Technical Indicators
10 Days EMA 1302.26
21 Days EMA 1298.58
50 Days EMA 1305.86
200 Days EMA 1251.78
Next Resistance Levels:
strong resistance level at: 1386.95 set on Mar 16, 2007
strong resistance level at: 1433.06 set on Aug 03, 2007
strong resistance level at: 1440.70 set on Nov 23, 2007
strong resistance level at: 1453.55 set on Sep 07, 2007
strong resistance level at: 1,530.23 set on May 30, 2007 (first closing high after dot com bubble)
strong resistance level at: 1,552.87 set on Mar 24, 2000 (all time high during dot com bubble)
strong resistance level at: 1,565.15 set on Oct 09, 2007 (all time high during housing buble before sub prime crisis)
Next Support Levels:
minor support level at 1305.86 - 50 Days EMA
strong support level at 1251.78 - 200 days EMA
strong support level at 1189.40 set on Nov 26, 2010
minor support level at 1064.59 set on Aug 27, 2010
strong support level at 1022.58 set on Jul 02, 2010
strong support level at 1036.18 set on Oct 30, 2009
strong support level at 946.21 set on Jun 12, 2009
strong support level at 827.37 set on Sep 27, 2002
strong support level at 683.38 set on Mar 06, 2009
strong support level at 638.73 set on Jul 19, 1996 - Might see this number again when completing double dip bottom
Posted on July 01, 2011
|
|