Stock Market - Dow Jones 1000 Points Intraday Swing
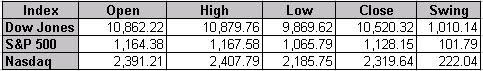
Here is the index value for May 06, 2010.
Based on technical's, market closed below its 50 days SMA (simple moving average) on S&P 500 at 1,165.87 on May 05, 2010. This may signal in advance that failure to hold 50 days moving average may take the index to 200 days moving average. However DOW was closed above its 50 days SMA at 10,868.12 Many time market will try to recover from these levels.
50 days and 200 days simple moving average for S&P 500 on the close 5th may 2010 is 1171.454, 1098.985. Similarly for Dow Jones is 10844.437, 10224.185. On 6th May, US Market opened with Dow Jones at 10,862 just above its 50 days moving average and S&P 500 at 1164 below its 50 days moving average.
At 2:23 PM S&P 500 was trading at 1128.94 which is more than 3.5% of its 50 days moving average clearly signals that downside breakout. At the same time, Dow Jones was trading at 10569.89 which is more than 2.5% below its 50 days moving average. As both indices has broken clearly, they may go down either to its 200 days moving average or its next strong support level.
This might have caused the algorithmic trading? Its only my guess. Or alternatively traders might be watching for these level to trigger their trades. The speed the market went down so much makes people to think that it is due to computerized algorithmic trading only.
At 2:48 PM, the Dow Jones was down to 998 points from the earlier day's close. Both S&P 500 and Dow Jones broke its 200 days moving average also. The next strong support level on S&P 500 is at 1056.74 on the close of Feb 8 2010. S&P 500 plunged up to 1065.79 and recovered to normal level 10520 at 3:11 PM. This completes the end of algorithmic trading for the day.
The Intraday swing on Dow Jones is more than 1000 points. This is the second highest intraday swing. The first rank is on October 10, 2008.
Posted on May 09, 2010
|
|