Housing Market Situation in June 2011
July 01, 2011 - With reference to S&P case shiller index release on June 28, 2011, US Composite 20 city index showing the increase in Home prices to 138.84 for the first time in 8 months. The last month (March) reading was at 137.93. This reading is based on Not-Seasonably Adjusted.
Market continues its rally by ignoring the fact the seasonable adjusted home price index for April 2011 is still lower. The following the seasonably adjusted home price index. The increase in Home price during April 2011 is having little positive impact on its seasonably adjusted data and it is not enough to show the increase from month to month in seasonably adjusted data.
Data Sources:
http://www.federalreserve.gov/monetarypolicy/openmarket.htm
http://www.standardandpoors.com/indices/main/en/us
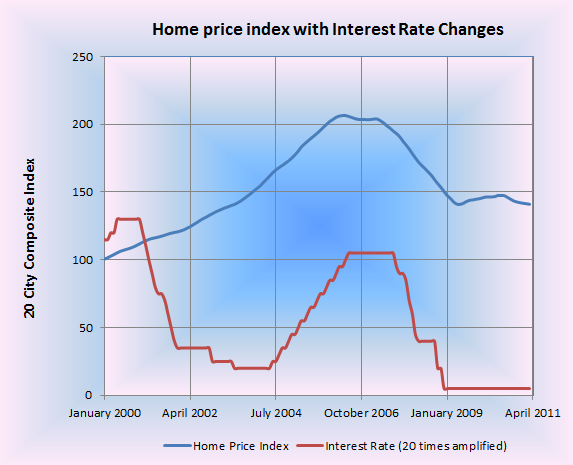
Historically if you compare to the recent past which is after 2000, fed was able to keep the interest rate less than 2% for 3 years. Currently the near zero percent interest rate is there since December 2008. If we count 3 years from December 2008, that would be December 2011. Chances are higher that Fed may start rising the interest rate from near zero percent from end of this year.
Note that even Feb started rising interest rate from Nov 2004, housing prices continue to climb for 18 months. Now it would be reverse scenario. Housing prices will continue to collapse when the Fed started rising the rate once again. Once Fed is increasing the rate, both housing and credit bubble-burst will see the final bottom after 12-18 months. This is a high level estimate and chances are higher the housing prices might see the final bottom before the presidential election of 2012.
Posted on July 01, 2011
|
|