Housing Market Situation in Jan 2012
Jan 14, 2012 , 2011 - With reference to S&P case shiller index release on Dec 27, 2011, US Composite 20 city index on Oct 2011 showing the decrease in Home prices by 1.74 points to 140.30. The last month (Sep 2011) reading was at 142.04. This reading is based on Not-Seasonably Adjusted.
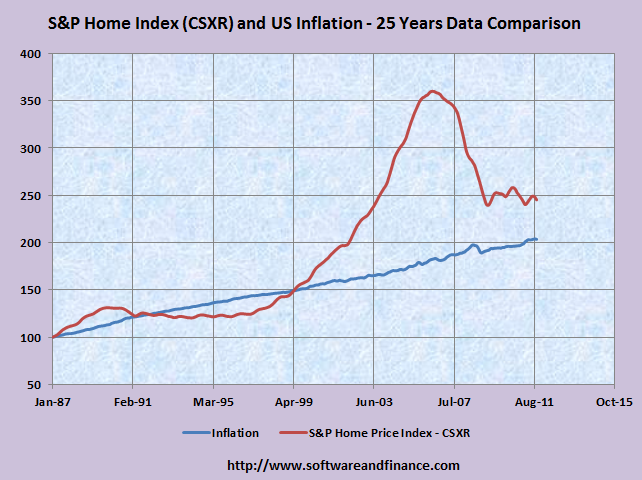
Here is the 25 years historical comparison chart for US inflation data versus S&P case Shiller index for Composite 10 cities Not seasonably adjusted data.
The difference between inflation and home price increase is getting narrowed from June 2006 to now. June 2006 is the time when housing market peaked. Till now the home price levels are moving down and trying to catch up the historical inflation rate.
With the following chart, we could see that housing market can bottom in the next two years. In other words, home prices can be stable in the coming months with high inflation rate that can also offset the difference. In April 1999, both lines have crossed, we need to see same pattern again. It can either happen with home prices going down further or inflation rate going higher. Lets wait and see!
Data Sources:
http://www.federalreserve.gov/monetarypolicy/openmarket.htm
http://www.standardandpoors.com/indices/main/en/us
Posted on Jan 14, 2012
|
|