Home Price Valuation Based On Inflation
Introduction
In this article, I have discussed the relationship between the inflation and the increase in home prices. The key factor comparing the inflation with their home price both at the time of buying and selling is ignored by many people.
Home prices were peaked in around May 2006 according to Standard & Poor's case-shiller index for 20 metro areas, but people continued their buying homes as the interest rate was low. Both low interest rates and subprime loans contributed to creating the hosing bubble.
Housing bubble is one of the key factors that lead to US stock market collapse and increased number of bank failures. Then stock market has been bottomed in March 6th 2009. The Dow Jones low was set at 6469.95 and S&P 500 low was at 666.79. Now the stock market indices have rallied and set their peak on Apr 26th 2010, Dow Jones was at 11258.01 and S&P 500 was at 1219.80.
Comparison with Inflation was ignored while buying and selling the house
The inflation data is from Bureau of Labor Statistics (http://www.bls.gov/). S&P/ Case-Shiller index is available in http://www.standardandpoors.com
I have done a brief analysis between the home prices with inflation data. Many people were surprised to see that home prices were undervalued by January 2000 compared with the inflation rate.
10 Years Analysis on Home Prices for 20 Metro Areas (January 2000 – March 2010)
Inflation was up by 19.96% from Jan 2000 to May 2006 where as Home prices increased by approximately 106.47% from Jan 2000 to May 2006 for 20 metro areas. Home prices increased by more than 5 times of inflation. Definitely that would not be the right time to buy home and it is excellent time to sell homes.
Inflation was up by 28.93% from Jan 2000 to March 2010 and home prices increased by approximately 45.00 % from Jan 2000 to March 2010 for 20 metro areas. Now the home prices were increased by 1.5 times of inflation when compared with the last 10 years data.
Let’s look at the 20 years data to get clearer picture.
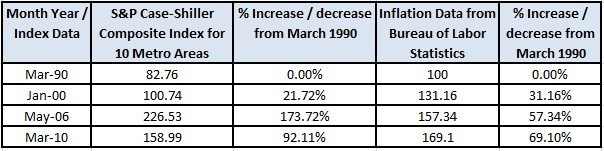
20 Years Analysis on Home Prices for 20 Metro Areas (March 1990 – Mar 2010)
From the following table, S&P Case-Shiller Composite Index for 10 Metro areas is increased by 21.72% in January 2000 and inflation was up by 31.16% compared to March 1990. So it is clear that home prices were undervalues by January 2000.
Home prices will fluctuate with demand and supply along with the current interest rate. But eventually at the end it should coincide with currency inflation rate. If home prices were higher compared with inflation because of high demand in the market, then the difference between the home price and inflation is called premium. In the same way, if the home prices were lower compared with inflation, then the difference would be the discount.
Look at the following table,
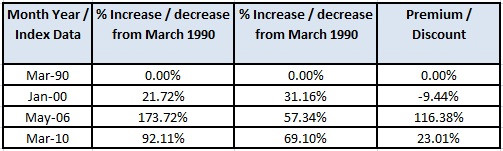
By January 2000, the home prices were trading with the discount of about 10% compared with March 1990. But by May 2006, home prices were at highest point and trading with the premium of 116.38%.
By looking at the history, anyone can comment that is not correct time to buy and what if home prices is increasing indefinitely? My argument is if you are buying anything, it is safe to buy when there is a discount in the market. However we may have to wait for couple of years or some decades to get the best price which would not be practical when people eagerly buy home for living and to get their children in good school districts.
From my personal perspective, it is OK to buy a home for living with a little premium. But it is not good to buy as an investment. By looking at the above table, currently home prices were trading at 23% premium and it is a reasonable price compared with May 2006 peak. But still the price has to go down to match with inflation and inflation will also go up in the coming years.
Over 3-5 years, again there will be a day when home prices will be trading with discount compared with inflation. That would be the bottom for home prices.
|
|