Nifty Weekly Forecast From Sep 10, 2012 - Nifty to Follow US Market for direction! (Expected Trading Range: 5000 - 5400)
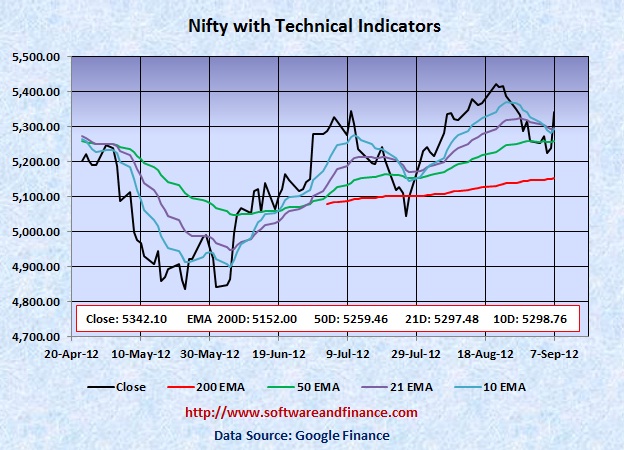
Sep 07, 2012 - Nifty closed today at 5342.10 which is about 84 points up from the last week close of 5258.50 on Aug 31, 2012. Nifty was trading between 5215.70 and 5347.15 that is the swing of about 131 points.
Note: US Market was closed on Monday, Sep 03, 2012 for Labor Day.
To watch Nifty Index in google finance, visit the following link:
NSE Index in Google Finance
To watch Nifty Index in yahoo finance, visit the following link:
NSE Index in Yahoo Finance
Last Week Analysis - Nifty was in rangebound trading sessions
S&P could set a new 52 high of 1437.92 immediately following is the worst Job report! Market will always make a fake move to confuse the investors before taking the correct move. Even though the Job numbers does not look good, market was moving up thinking that Fed will not increase the interest rate so that housing prices will stablize. Market was going up beliving that S&P will touch its all time high of 1565.15 again!
No matter what, Fed has already created the credit bubble by keeping the interest rate low for over 3 years. And this credit bubble will burst; this is going to be a very surprise and another disaster to the economy. The americal workforce dropped to the lowest level in 31 years. Market is getting ready to crash! But the only question is whether it will happen immediately before or immediately after the US presidential election.
US will hold presidential elections on Nov 06, 2012
With respect to US long term treasury prices, TLT closed today at 124.03 which is a big loss of 2.89% for this week compared to the last week close of 127.72. However TLT reached its all time high point of 132.21 on July 25, 2012. The upside is very much limited on US treasuries and downside is huge. In the short time, it will go up. So if you are trading on US treasuries in the short term, it is a good time to liquidate your long position on US treasuries.
Last Week Low: 5215.70
Last Week High: 5347.15
Not Safe to hold your long positions on Nifty
Nifty trading above its 200 days EMA, is considered as an exit point for your long position on equities. It may continue its bull run but it does not promise anything. If you are conservative investors, hold currency or indian T-Bills. You can take long positions on Nifty between 4000 and 4500.
Nifty might experience a double dip in Indian Market along with world market correction in the long term (about one and half years). With double dip, Nifty is expected to touch 2600 levels set on Oct 2008 and Mar 2009. Wait for some more time to get more clues on "double dip on Nifty"
For Speculators and Intraday Players - Bet On Volatility
CBOE Volatility Index (VIX) closed today at 14.38 which is a strong loss of over 17% from the last week low of 17.47. The strong slump in VIX signals that market does not have any fear and is going to make a powerful upmove. Still fundamentally the US market is very week due to unemployment and slumping house prices along with US debt downgrade. Always fundamental wins in the long run. You can consider taking long positios on VIX also.
Only if you are day trader, you can have the following options:
1. Buy 1X OTM call option and 2X OTM put option - Long Strip.
2. Long Stocks and stop loss orders
3. Long Stocks with long put options
Note: OTM - means Outside the money.
Technical Indicators
Next Resistance Levels:
Psychological Resistence Level at: 5400.00
Strong Resistence level at: 5360.70 - Set on Oct 28, 2011
Strong Resistence level at: 5633.95 - Set on Jul 22, 2011
Strong Resistence level at: 5884.70 - Set on Apr 28, 2011
Strong Resistence level at: 6134.50 - Set on Dec 31, 2010
Strong Resistence level at: 6274.30 - Set on Jan 04, 2008
Strong Resistence level at: 6312.45 - Set on Nov 05, 2010 (Double Top of Jan 04, 2008)
Next Support Levels:
Strong Support level at: 5259.46 Set by 50 days EMA
Strong Support level at: 5152.00 Set by 200 days EMA
Psychological Support Level at: 5000.00
Strong support level at 4835.65 set on May 23, 2012
Strong support level at 4718.00 set on Feb 05, 2010
Strong support level at 4639.10 set on Nov 24, 2011
Minor Support level at 4531.15 set on Dec 20, 2011
Strong support level at 4003.90 set on Jul 10, 2009
Strong support level at 2620.10 set on Mar 06, 2009 Will reach here with double dip
Strong support level at 2584.00 set on Oct 24, 2008 Will reach here with double dip
Posted on Sep 09, 2012
|
|