Nifty Weekly Forecast From Oct 29, 2012 - Nifty to follow US Market! (Expected Trading Range: 5279 - 5787)
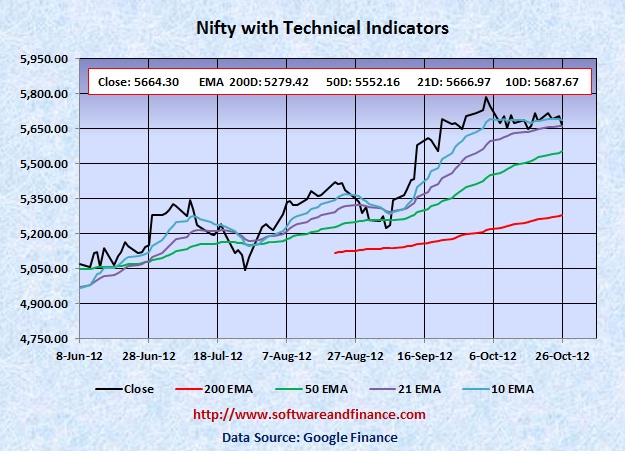
Oct 26, 2012 - Nifty closed today at 5664.30 which is about 20 points down from the last week close of 5684.25 on Oct 19, 2012. Nifty was trading between 5641.75 and 5721.55 that is the swing of about 80 points.
To watch Nifty Index in google finance, visit the following link:
NSE Index in Google Finance
To watch Nifty Index in yahoo finance, visit the following link:
NSE Index in Yahoo Finance
Last Week Analysis - Earnings from Apple,Amazon and Windows 8 Launch
No matter what, Fed has already created the credit bubble by keeping the interest rate low for about 4 years. And this credit bubble will burst; this is going to be a very surprise and another disaster to the economy. The american workforce dropped to the lowest level in 31 years. Market is getting ready to crash! But the only question is whether it will happen immediately before or immediately after the US presidential election. Porlonged rate cuts helped to create new Jobs and reduce the unemployment news. Which in turn becomes negative on increasing the interest rate that is not positive for the market. In another look, market will not care about increasing the interest rate.
The earnings from Apple and its outlook clearly informs the market that it is slowing down because of two reasons: It is running out of new bullets and It is facing severe competition from Microsoft & its partners on both Windos 8 Phone and Surface Tablet. The future of Surface is too early to predict since we need to get statistics and feedback from the consumer market that will take about a couple of weeks to months. However it is surely created a big slow down to Apple. Amazon filed a loss of 23 cents per share on last quarter however market was expecting only 8 cents. Windows 8 launch Oct 25, 2012 is a new era for microsoft and to the world.
US will hold presidential elections on Nov 06, 2012
With respect to US long term treasury prices, TLT closed today at 122.64 which is a small gain from the last week close of 121.71. TLT reached its all time high point of 132.21 on July 25, 2012. In the short time, TLT may make a siginificant upward move. So if you are trading on US treasuries in the short term, it is a good time to take long position on US treasuries.
Last Week Low: 5641.75
Last Week High: 5721.55
Not Safe to hold your long positions on Nifty
Nifty trading well above its 200 days EMA, is considered as an exit point for your long position on equities. It may continue its bull run but it does not promise anything. If you are conservative investors, hold currency or indian T-Bills. You can take long positions on Nifty between 4000 and 4500.
Nifty might experience a double dip in Indian Market along with world market correction in the long term (about one and half years). With double dip, Nifty is expected to touch 2600 levels set on Oct 2008 and Mar 2009. Wait for some more time to get more clues on "double dip on Nifty"
For Speculators and Intraday Players - Bet On Volatility
CBOE Volatility Index (VIX) closed today at 17.81 which a near flat compared to the last week close of 17.06. Now the market is showing some fear compared to the earlier weeks, but still VIX is going to make a powerful upmove Since fundamentally the US market is very week due to unemployment and slumping house prices along with US debt downgrade. Always fundamental wins in the long run. You can consider taking long positios on VIX also.
Only if you are day trader, you can have the following options:
1. Buy 1X OTM call option and 2X OTM put option - Long Strip.
2. Long Stocks and stop loss orders
3. Long Stocks with long put options
Note: OTM - means Outside the money.
Technical Indicators
Next Resistance Levels:
Strong Resistence level at: 6312.45 on Nov 05, 2010
Psychological Resistence Level at: 6000.00
Strong Resistence level at: 5360.70 - Set on Oct 28, 2011
Strong Resistence level at: 5633.95 - Set on Jul 22, 2011
Strong Resistence level at: 5884.70 - Set on Apr 28, 2011
Strong Resistence level at: 6134.50 - Set on Dec 31, 2010
Strong Resistence level at: 6274.30 - Set on Jan 04, 2008
Strong Resistence level at: 6312.45 - Set on Nov 05, 2010 (Double Top of Jan 04, 2008)
Next Support Levels:
Strong Support level at: 5552.16 Set by 50 days EMA
Strong Support level at: 5279.42 Set by 200 days EMA
Psychological Support Level at: 5000.00
Strong support level at 4835.65 set on May 23, 2012
Strong support level at 4718.00 set on Feb 05, 2010
Strong support level at 4639.10 set on Nov 24, 2011
Minor Support level at 4531.15 set on Dec 20, 2011
Strong support level at 4003.90 set on Jul 10, 2009
Strong support level at 2620.10 set on Mar 06, 2009 Will reach here with double dip
Strong support level at 2584.00 set on Oct 24, 2008 Will reach here with double dip
Posted on Oct 26, 2012
|
|