Nifty Weekly Forecast From Nov 26, 2012 - Nifty will fall back to 5330 (Expected Trading Range: 5279 - 5682)
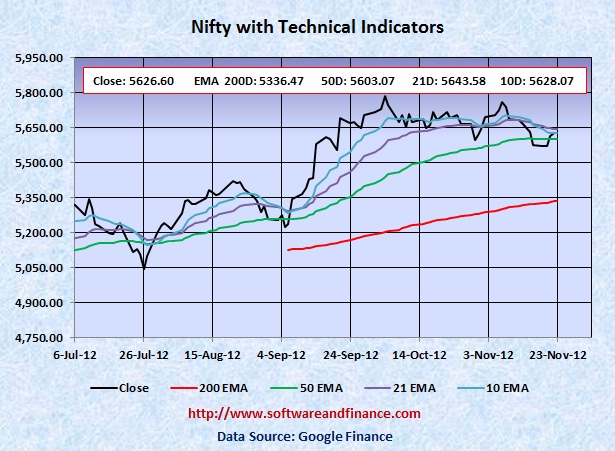
Nov 23, 2012 - Nifty closed today at 5626.60 which is about 53 points up from the last week close of 5574.05 on Nov 16, 2012. Nifty was trading between 5548.35 and 5643.30 that is the swing of about 94 points.
To watch Nifty Index in google finance, visit the following link:
NSE Index in Google Finance
To watch Nifty Index in yahoo finance, visit the following link:
NSE Index in Yahoo Finance
Last Week Analysis - Market got Thanksgiving Sales Boost!
US Stock Market Indices recovered strongly during holiday shortened thanksgiving week. Since the market is oversold in the short term and people are ready to do shopping for the famous Black Friday Sale.
Since equities started bouncing off, US long term treasury prices moved down. TLT closed today at 124.30 compared to the last week close of 126.36. TLT reached its all time high point of 132.21 on July 25, 2012. In the short time, TLT may make a siginificant upward move. So if you are trading on US treasuries in the short term, it is a good time to take long position on US treasuries.
Last Week Low: 5548.35
Last Week High: 5543.30
Not Safe to hold your long positions on Nifty
Nifty is approaching its strong resistance level and it is a time for Nifty to test its 200 days EMA of 5336.47. Nifty has not seen its 200 days EMA for the last over 120 days.
Nifty trading well above its 200 days EMA, is considered as an exit point for your long position on equities. It may continue its bull run but it does not promise anything. If you are conservative investors, hold currency or indian T-Bills. You can take long positions on Nifty between 4000 and 4500.
Nifty might experience a double dip in Indian Market along with world market correction in the long term (about one and half years). With double dip, Nifty is expected to touch 2600 levels set on Oct 2008 and Mar 2009. Wait for some more time to get more clues on "double dip on Nifty"
For Speculators and Intraday Players - Bet On Volatility
CBOE Volatility Index (VIX) closed today at 15.14 which is significant loss compared to the last week close of over 18. Now the market is not showing any fear compared to post election, but still VIX is going to make a powerful upmove Since fundamentally the US market is very week due to unemployment and slumping house prices along with US debt downgrade. Always fundamental wins in the long run. You can consider taking long positios on VIX also.
Only if you are day trader, you can have the following options:
1. Buy 1X OTM call option and 2X OTM put option - Long Strip.
2. Long Stocks and stop loss orders
3. Long Stocks with long put options
Note: OTM - means Outside the money.
Technical Indicators
Next Resistance Levels:
Strong Resistence level at: 6312.45 on Nov 05, 2010
Psychological Resistence Level at: 6000.00
Strong Resistence level at: 5360.70 - Set on Oct 28, 2011
Strong Resistence level at: 5633.95 - Set on Jul 22, 2011
Strong Resistence level at: 5884.70 - Set on Apr 28, 2011
Strong Resistence level at: 6134.50 - Set on Dec 31, 2010
Strong Resistence level at: 6274.30 - Set on Jan 04, 2008
Strong Resistence level at: 6312.45 - Set on Nov 05, 2010 (Double Top of Jan 04, 2008)
Next Support Levels:
Strong Support level at: 5603.07 Set by 50 days EMA
Strong Support level at: 5336.47 Set by 200 days EMA
Psychological Support Level at: 5000.00
Strong support level at 4835.65 set on May 23, 2012
Strong support level at 4718.00 set on Feb 05, 2010
Strong support level at 4639.10 set on Nov 24, 2011
Minor Support level at 4531.15 set on Dec 20, 2011
Strong support level at 4003.90 set on Jul 10, 2009
Strong support level at 2620.10 set on Mar 06, 2009 Will reach here with double dip
Strong support level at 2584.00 set on Oct 24, 2008 Will reach here with double dip
Posted on Nov 25, 2012
|
|