Nifty Weekly Forecast From May 28, 2012 - Market Rally to continue! (Expected Trading Range: 4718 - 5095)
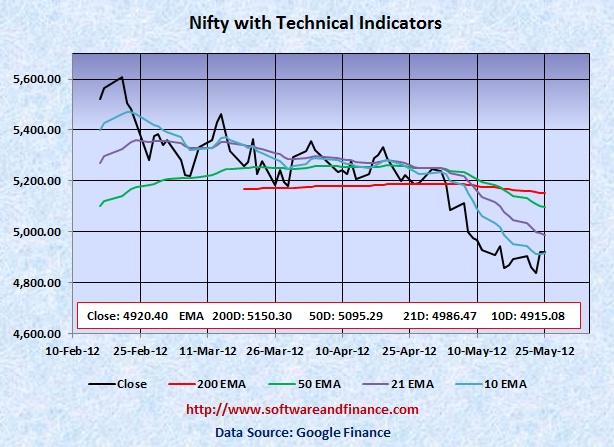
May 25, 2012 - Nifty closed today at 4920.40 which is about 29 points up from the last week close of 4891.45 on May 18, 2012. Nifty was trading between 4803.95 and 4956.35 that is the swing of 152 points.
To watch Nifty Index in google finance, visit the following link:
NSE Index in Google Finance
To watch Nifty Index in yahoo finance, visit the following link:
NSE Index in Yahoo Finance
Last Week Analysis - Market regained its 10 days EMA
Every day news coming out from Euro Zone created a huge panic in the market. Facebook IPO is overhyped in the market. The current P/E ratio is 102.1X which is huge for social media company. If Facebook did not do well in the next quarter, then it will erase at least 50% of its value and will put FB to trade near teens. However Market tried to regain its support level of 10 days EMA and confirms that it can rally upto 4986 at least and then 5095 before it continues downturn.
US will hold presidential elections on Nov 06, 2012.
With respect to US long term treasury prices, TLT closed today at 123.40 which is a doube top of its 52 weeks high point of 125.03. It is the perfect time to initate short position US treasuries. The upside is very much limited on US treasuries and downside is huge.
Last Week Low: 4803.95
Last Week High: 4956.35
Cover your short position and go long on Indian Equities
It is time to cover all of your short positions on Nifty and create new long position. Nifty has reached its short term bottom and getting ready for a big bounce.
If you are conservative investors, hold currency or indian T-Bills. You can take long positions on Nifty between 4000 and 4500. Note that Market will move up now before it goes down!
Nifty might experience a double dip in Indian Market along with world market correction in the long term (about one and half years). With double dip, Nifty is expected to touch 2600 levels set on Oct 2008 and Mar 2009. Wait for some more time to get more clues on "double dip on Nifty"
For Speculators and Intraday Players - Long Stocks with Stop Loss Orders and Long Options Strap
CBOE Volatility Index (VIX) closed at 21.76 today. Before VIX reaches 40, it has to go down first before it moves up. It is also good idea to liquidate your long positions on VIX. Still fundamentally the US market is very week due to unemployment and slumping house prices along with US debt downgrade. Always fundamental wins in the long run.
Only if you are day trader, you can have the following options:
1. Buy 2X OTM call option and 1X OTM put option.
2. Long Stocks and stop loss orders.
3. Long Stocks with long put options
Note: OTM - means Outside the money.
Technical Indicators
10 days EMA: 4915.08
21 days EMA: 4986.47
50 days EMA: 5095.29
200 days EMA: 5150.30
Next Resistance Levels:
Resistence level at 5000.00 set by psychological level
Strong Resistence level at: 5095.29 Set by 50 days EMA
Strong Resistence level at: 5150.30 Set by 200 days EMA
Strong Resistence level at: 5360.70 - Set on Oct 28, 2011
Strong Resistence level at: 5633.95 - Set on Jul 22, 2011
Strong Resistence level at: 5884.70 - Set on Apr 28, 2011
Strong Resistence level at: 6134.50 - Set on Dec 31, 2010
Strong Resistence level at: 6274.30 - Set on Jan 04, 2008
Strong Resistence level at: 6312.45 - Set on Nov 05, 2010 (Double Top of Jan 04, 2008)
Next Support Levels:
Strong support level at 4718.00 set on Feb 05, 2010
Strong support level at 4639.10 set on Nov 24, 2011
Minor Support level at 4531.15 set on Dec 20, 2011
Strong support level at 4003.90 set on Jul 10, 2009
Strong support level at 2620.10 set on Mar 06, 2009 Will reach here with double dip
Strong support level at 2584.00 set on Oct 24, 2008 Will reach here with double dip
Posted on May 26, 2012
|
|