Nifty Weekly Forecast From May 07, 2012 - Ready to go below 5000? (Expected Trading Range: 4718 - 5100)
May 04, 2012 - Nifty closed today at 5085.85 which is about 104 points down (2%) from the last week close of 5190.60 on Apr 27, 2012. Nifty was trading between 5070.60 and 5279.60 that is the swing of 209 points.
To watch Nifty Index in google finance, visit the following link:
NSE Index in Google Finance
To watch Nifty Index in yahoo finance, visit the following link:
NSE Index in Yahoo Finance
Last Week Analysis - S&P downgrades India - Stable to Negative
S&P downgraded indian market outlook from stable to negative that pushed the market down for another consequtive week and closed in red. The disappointing monthly jobs and unemployment report on Friday triggered accelerated selling on major indices in US market.
I have been saying in the past couple of weeks that oil prices have been gone up so fast in the last 6 months. As we are getting closer to election, oil lost its ground and down by 4% on single trading day, that is Friday May 04, 2012.
US will hold presidential elections on Nov 06, 2012.
With respect to US long term treasury prices, TLT closed today at 118.14 which is 85 cents up for the week compared to last week close of 117.29. US treasury is bit late to good buy now since it bounced a lot this week. But if you are short on US treasuries, you have to liquidate your short position. US treasuries (Ticker: TLT) TLT upside is huge now that is towards 125-130. You can short US treasuries again when it reaches above 125 onwards.
Last Week Low: 5070.60
Last Week High: 5279.60
It is time to liquidate all of your long positions on Nifty and create new short position. We do not have any history of running into bull market crossing over 200 days EMA in one shot. It has to go through a couple of retesting. Still market has to go through lots of bad news from Euro Zone, downgrades, unemployment, etc.
If you are conservative investors, hold currency or indian T-Bills rather than creating short position on Nifty. You can take long positions on Nifty between 4000 and 4500.
Nifty might experience a double dip in Indian Market along with world market correction in the long term (about one and half years). With double dip, Nifty is expected to touch 2600 levels set on Oct 2008 and Mar 2009. Wait for some more time to get more clues on "double dip on Nifty"
For Speculators and Intraday Players - Options Strip
1. Buy 2X OTM put option and 1X OTM call option - Options Strip.
2. Short Stocks and stop loss orders.
3. Short Stocks with long call options
Note: OTM - means Outside the money.
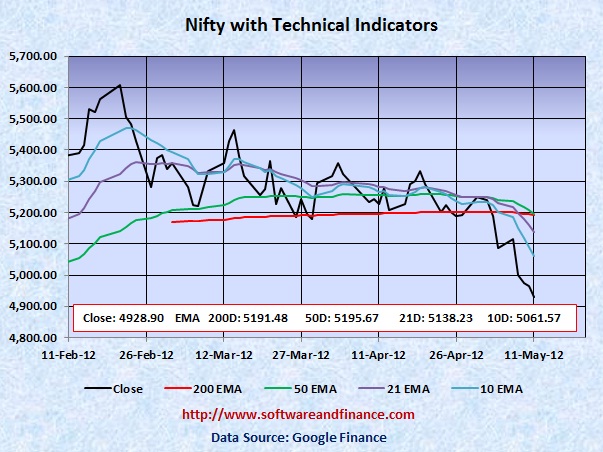
Technical Indicators
10 days EMA: 5200.10
21 days EMA: 5229.24
50 days EMA: 5240.44
200 days EMA: 5210.24
Next Resistance Levels:
Strong Resistence level at: 5360.70 - Set on Oct 28, 2011
Strong Resistence level at: 5633.95 - Set on Jul 22, 2011
Strong Resistence level at: 5884.70 - Set on Apr 28, 2011
Strong Resistence level at: 6134.50 - Set on Dec 31, 2010
Strong Resistence level at: 6274.30 - Set on Jan 04, 2008
Strong Resistence level at: 6312.45 - Set on Nov 05, 2010 (Double Top of Jan 04, 2008)
Next Support Levels:
Minor support level at 5210.24 set by 200 days EMA
Minor support level at 5240.44 set by 50 days EMA
Support Level at 5000.00 set by psychological level
Strong support level at 4718.00 set on Feb 05, 2010
Strong support level at 4639.10 set on Nov 24, 2011
Minor Support level at 4531.15 set on Dec 20, 2011
Strong support level at 4003.90 set on Jul 10, 2009
Strong support level at 2620.10 set on Mar 06, 2009 Will reach here with double dip
Strong support level at 2584.00 set on Oct 24, 2008 Will reach here with double dip
Posted on May 05, 2012
|
|