Nifty Weekly Forecast From Jun 11, 2012 - Range Bound Trading to Begin! (Expected Trading Range: 4970 - 5117)
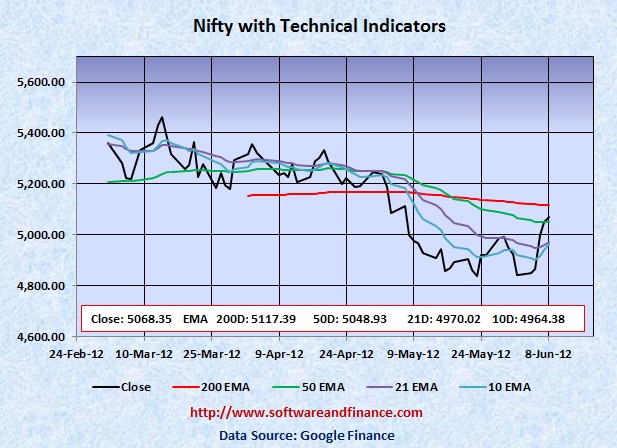
Jun 08, 2012 - Nifty closed today at 5068.35 which is about 227 points up from the last week close of 4841.60 on Jun 01, 2012. Nifty was trading between 4770.35 and 5084.45 that is the swing of 314 points.
To watch Nifty Index in google finance, visit the following link:
NSE Index in Google Finance
To watch Nifty Index in yahoo finance, visit the following link:
NSE Index in Yahoo Finance
Last Week Analysis - Powerful rally from Oversold condition
Every day news coming out from Euro Zone created a huge panic in the market. As predicted last week, US treasuries started collapsing from its multi decade low yields. Everyone wants front run the Fed by taking long positions on US treasuries. Fed is not going to buy at high price on its long dated securities. As expected Fed Chairman Ben Bernanke did not indicate any quantitative easing on his testimony. The most disappointed ameatur investors did exit from long position on US treasury securities.
As a result, Nifty enjoyed a powerful rally of about 4.68% and now it is due to test its 200 days EMA of 5117.39.
US will hold presidential elections on Nov 06, 2012
With respect to US long term treasury prices, TLT closed today at 125.21 after losing 3.95% for this week compared to the last week close of 130.36. It is the perfect time to initate short position US treasuries. The upside is very much limited on US treasuries and downside is huge.
Last Week Low: 4770.35
Last Week High: 5084.45
Watch out Nifty at 5117
Once Nifty reached 5117, it is an exit point for your long position on equities. It may continue its bull run but it does not promise anything. If you are conservative investors, hold currency or indian T-Bills. You can take long positions on Nifty between 4000 and 4500.
Nifty might experience a double dip in Indian Market along with world market correction in the long term (about one and half years). With double dip, Nifty is expected to touch 2600 levels set on Oct 2008 and Mar 2009. Wait for some more time to get more clues on "double dip on Nifty"
For Speculators and Intraday Players - Long Stocks with Stop Loss Orders and Long Options Strap
CBOE Volatility Index (VIX) closed today at 21.23 today. VIS has to consolidate from these levels before it makes up a powerful upmove. Still fundamentally the US market is very week due to unemployment and slumping house prices along with US debt downgrade. Always fundamental wins in the long run.
Only if you are day trader, you can have the following options:
1. Buy 2X OTM call option and 1X OTM put option.
2. Long Stocks and stop loss orders.
3. Long Stocks with long put options
Note: OTM - means Outside the money.
Technical Indicators
10 days EMA: 4964.37
21 days EMA: 4970.02
50 days EMA: 5048.93
200 days EMA: 5117.39
Next Resistance Levels:
Strong Resistence level at: 5117.39 Set by 200 days EMA
Strong Resistence level at: 5360.70 - Set on Oct 28, 2011
Strong Resistence level at: 5633.95 - Set on Jul 22, 2011
Strong Resistence level at: 5884.70 - Set on Apr 28, 2011
Strong Resistence level at: 6134.50 - Set on Dec 31, 2010
Strong Resistence level at: 6274.30 - Set on Jan 04, 2008
Strong Resistence level at: 6312.45 - Set on Nov 05, 2010 (Double Top of Jan 04, 2008)
Next Support Levels:
Minor Support level at: 5048.93 Set by 50 days EMA
Psychological Support Level at: 5000.00
Strong support level at 4835.65 set on May 23, 2012
Strong support level at 4718.00 set on Feb 05, 2010
Strong support level at 4639.10 set on Nov 24, 2011
Minor Support level at 4531.15 set on Dec 20, 2011
Strong support level at 4003.90 set on Jul 10, 2009
Strong support level at 2620.10 set on Mar 06, 2009 Will reach here with double dip
Strong support level at 2584.00 set on Oct 24, 2008 Will reach here with double dip
Posted on June 09, 2012
|
|