Nifty Weekly Forecast From July 30, 2012 - Market moved down to 200 days EMA! (Expected Trading Range: 4920 - 5151)
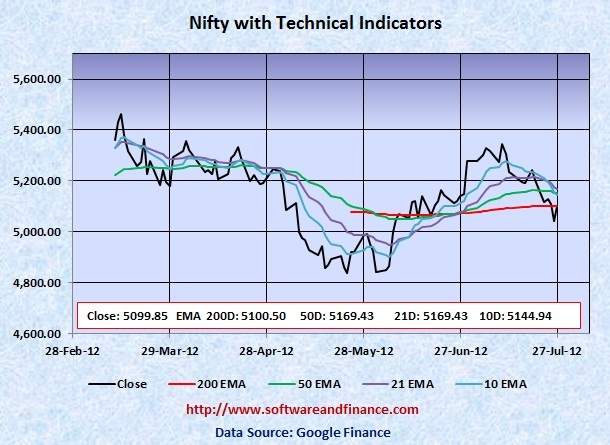
Jul 28, 2012 - Nifty closed today at 5099.85 which is about 105 points down from the last week close of 5205.10 on July 20, 2012. Nifty was trading between 5032.40 and 5164.20 that is the swing of 132 points.
To watch Nifty Index in google finance, visit the following link:
NSE Index in Google Finance
To watch Nifty Index in yahoo finance, visit the following link:
NSE Index in Yahoo Finance
Last Week Analysis - Market tested its 200 days EMA
US Treasuries (TLT) topped 132.21 by mid of last week and this created no room for treasuries to rally further. On Thursday July 26, 2012, comments from Mario Draghi, President of European Central Bank during the conference at the Olympics, helped to push the US and Euro Markets higher. It is considered as a short covering rally and bear market rally. There is no true signs of growing economy.
Even though Nifty gained over the last trading day, it just helped to regain its support level of its 200 days EMA. It reconfirms that developing and emerging markets are leading the worldwide downturn.
There is a big disappointing earnings and outlook from facebook, sent its stocks intra-week lower to 22.28. But still FB is overvalued and its fair value should be around 5 dollars. Even after plummeting by close to 40% from its IPO price of 38, its P/E ratio is at 127.02. We can expect Facebook to trade in teens very soon, with in the next quarter.
US will hold presidential elections on Nov 06, 2012
With respect to US long term treasury prices, TLT closed today at 128.48 which is little loss for this week compared to the last week close of 130.4. However TLT reached its all time high point of 132.21. It is the perfect time to initate short position US treasuries. The upside is very much limited on US treasuries and downside is huge.
Last Week Low: 5032.40
Last Week High: 5164.20
Not Safe to hold your long positions on Nifty
Nifty trading its 200 days EMA, is considered as an exit point for your long position on equities. It may continue its bull run but it does not promise anything. If you are conservative investors, hold currency or indian T-Bills. You can take long positions on Nifty between 4000 and 4500.
Nifty might experience a double dip in Indian Market along with world market correction in the long term (about one and half years). With double dip, Nifty is expected to touch 2600 levels set on Oct 2008 and Mar 2009. Wait for some more time to get more clues on "double dip on Nifty"
For Speculators and Intraday Players - Bet On Volatility
CBOE Volatility Index (VIX) closed today around 16.70 today which is near flat for the week. The collapse of VIX signals that market does not have any fear and is going to make a powerful upmove. Still fundamentally the US market is very week due to unemployment and slumping house prices along with US debt downgrade. Always fundamental wins in the long run. You can consider taking long positios on VIX also.
Only if you are day trader, you can have the following options:
1. Buy 1X OTM call option and 1X OTM put option - Long Strangle.
2. Long Stocks and stop loss orders
3. Long Stocks with long put options
Note: OTM - means Outside the money.
Technical Indicators
10 days EMA: 5144.94
21 days EMA: 5169.43
50 days EMA: 5151.92
200 days EMA: 5100.50
Next Resistance Levels:
Strong Support level at: 5151.92 Set by 50 days EMA
Psychological Resistence Level at: 5300.00
Strong Resistence level at: 5360.70 - Set on Oct 28, 2011
Strong Resistence level at: 5633.95 - Set on Jul 22, 2011
Strong Resistence level at: 5884.70 - Set on Apr 28, 2011
Strong Resistence level at: 6134.50 - Set on Dec 31, 2010
Strong Resistence level at: 6274.30 - Set on Jan 04, 2008
Strong Resistence level at: 6312.45 - Set on Nov 05, 2010 (Double Top of Jan 04, 2008)
Next Support Levels:
Strong Support level at: 5100.50 Set by 200 days EMA
Psychological Support Level at: 5000.00
Strong support level at 4835.65 set on May 23, 2012
Strong support level at 4718.00 set on Feb 05, 2010
Strong support level at 4639.10 set on Nov 24, 2011
Minor Support level at 4531.15 set on Dec 20, 2011
Strong support level at 4003.90 set on Jul 10, 2009
Strong support level at 2620.10 set on Mar 06, 2009 Will reach here with double dip
Strong support level at 2584.00 set on Oct 24, 2008 Will reach here with double dip
Posted on July 29, 2012
|
|