Nifty Weekly Forecast From July 16, 2012 - Market will continue to go down! (Expected Trading Range: 5100 - 5320)
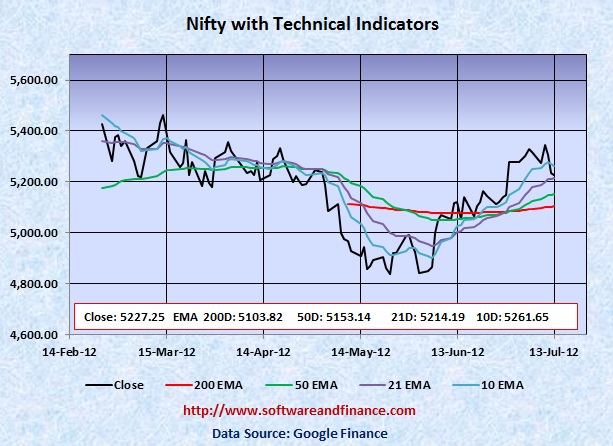
Jul 13, 2012 - Nifty closed today at 5227.25 which is about 90 points down from the last week close of 5316.95 on July 06, 2012. Nifty was trading between 5216.85 and 5348.55 that is the swing of 132 points.
To watch Nifty Index in google finance, visit the following link:
NSE Index in Google Finance
To watch Nifty Index in yahoo finance, visit the following link:
NSE Index in Yahoo Finance
Last Week Analysis - No more Stimulus from Fed
When the FOMC Meeting minutes came out on July 11, 2012, US Dollar Index moved very strongly across all major currencies. The following is the exact message given be Fed Indicating that No more Further Easing is unlikely since it will increase the inflation.
"One implication of the view that there is relatively little slack is that providing more monetary stimulus would be likely to raise inflation above the Committee's objective"
Reference: http://www.federalreserve.gov/monetarypolicy/fomcminutes20120620.htm
Stonger dollar policy is most common scenario during the election year that can help to push the commodity prices including oil and gold to their lower levels.
Even though market rallied last week to the close, the stronger dollar will hurt the profit of the export companies in USA that can lead to the Nasdaq correction. Right now Nifty is critical point and it is time exit from the market and it is not safe to hold long positions on Nifty.
US will hold presidential elections on Nov 06, 2012
With respect to US long term treasury prices, TLT closed today at 129.17 which is stronger gain for this week compared to the last week close of 127.06. It is the perfect time to initate short position US treasuries. The upside is very much limited on US treasuries and downside is huge.
Last Week Low: 5216.85
Last Week High: 5348.55
Not Safe to hold your long positions on Nifty
Nifty trading above its 200 days EMA, is considered as an exit point for your long position on equities. It may continue its bull run but it does not promise anything. If you are conservative investors, hold currency or indian T-Bills. You can take long positions on Nifty between 4000 and 4500.
Nifty might experience a double dip in Indian Market along with world market correction in the long term (about one and half years). With double dip, Nifty is expected to touch 2600 levels set on Oct 2008 and Mar 2009. Wait for some more time to get more clues on "double dip on Nifty"
For Speculators and Intraday Players - Bet On Volatility
CBOE Volatility Index (VIX) closed today around 16.74 today which is near flat for the week. The collapse of VIX signals that market does not have any fear and is going to make a powerful upmove. Still fundamentally the US market is very week due to unemployment and slumping house prices along with US debt downgrade. Always fundamental wins in the long run. You can consider taking long positios on VIX also.
Only if you are day trader, you can have the following options:
1. Buy 1X OTM call option and 1X OTM put option - Long Strangle.
2. Long Stocks and stop loss orders
3. Long Stocks with long put options
Note: OTM - means Outside the money.
Technical Indicators
10 days EMA: 5261.65
21 days EMA: 5214.19
50 days EMA: 5153.14
200 days EMA: 5103.82
Next Resistance Levels:
Psychological Resistence Level at: 5300.00
Strong Resistence level at: 5360.70 - Set on Oct 28, 2011
Strong Resistence level at: 5633.95 - Set on Jul 22, 2011
Strong Resistence level at: 5884.70 - Set on Apr 28, 2011
Strong Resistence level at: 6134.50 - Set on Dec 31, 2010
Strong Resistence level at: 6274.30 - Set on Jan 04, 2008
Strong Resistence level at: 6312.45 - Set on Nov 05, 2010 (Double Top of Jan 04, 2008)
Next Support Levels:
Strong Support level at: 5103.82 Set by 200 days EMA
Psychological Support Level at: 5000.00
Strong support level at 4835.65 set on May 23, 2012
Strong support level at 4718.00 set on Feb 05, 2010
Strong support level at 4639.10 set on Nov 24, 2011
Minor Support level at 4531.15 set on Dec 20, 2011
Strong support level at 4003.90 set on Jul 10, 2009
Strong support level at 2620.10 set on Mar 06, 2009 Will reach here with double dip
Strong support level at 2584.00 set on Oct 24, 2008 Will reach here with double dip
Posted on July 15, 2012
|
|