Nifty Weekly Forecast From Feb 06, 2012 - Get ready for a free fall from 15% market rally this year! (Expected Trading Range: 4868 - 5360)
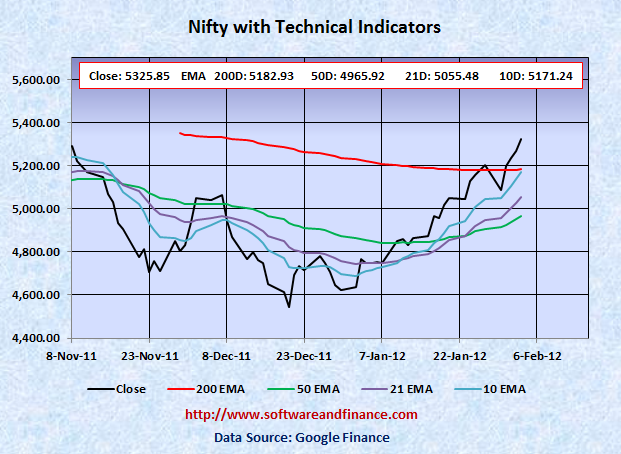
Feb 03, 2012 - Nifty closed today at 5325.85 which is about 121 points up (2.33%) from the last week close of 5204.70 on Jan 27, 2012. Nifty was trading between 5087.30 - 5334.85 which is about the swing of 248 points.
To watch Nifty Index in google finance, visit the following link:
NSE Index in Google Finance
To watch Nifty Index in yahoo finance, visit the following link:
NSE Index in Yahoo Finance
Last Week Analysis - Bulls are controlling the market
Nifty was up by 2.33% for the last week and was up by 15.18% for year to date.
FYI - France will hold presidential elections on April 22 and May 6, followed by general elections in June.
US will hold presidential elections on Nov 06, 2012.
Speculators and chart slaves following the charts claiming that bull market is back. Note that you will never see a bull market rally for 15% in 5 weeks. It can happen only in bear market.
With respect to US long term treasury prices, TLT closed today at 116.57 which a loss of about 1.3% for the week compared to last week close of 118.10. US treasury is now too late to short and too early to buy. But if you are short on US treasuries, you can liquidate your short position. US treasuries (Ticker: TLT) would bottom near 100 - 103 and TLT upside would be maximum of 125-130.
Last Week Low: 5087.30
Last Week High: 5334.85
It is time to liquidate all of your long positions on Nifty and create new short position. We do not have any history of running into bull market crossing over 200 days EMA in one shot. It has to go through a couple of retesting. Still market has to go through lots of bad news from Euro Zone, downgrades, unemployment, etc.
If you are conservative investors, hold currency or indian T-Bills rather than creating short position on Nifty. You can take long positions on Nifty between 4000 and 4500.
Nifty might experience a double dip in Indian Market along with world market correction in the long term (about one and half years). With double dip, Nifty is expected to touch 2600 levels set on Oct 2008 and Mar 2009. Wait for some more time to get more clues on "double dip on Nifty"
For Speculators and Intraday Players - Options Strip
1. Buy 2X OTM put option and 1X OTM call option - Options Strip.
2. Short Stocks and stop loss orders.
3. Short Stocks with long call options
Note: OTM - means Outside the money.
Technical Indicators
10 days EMA: 5171.24
21 days EMA: 5055.48
50 days EMA: 4965.92
200 days EMA: 5182.93
Next Resistance Levels:
Strong Resistence level at: 5360.70 - Set on Oct 28, 2011
Strong Resistence level at: 5633.95 - Set on Jul 22, 2011
Strong Resistence level at: 5884.70 - Set on Apr 28, 2011
Strong Resistence level at: 6134.50 - Set on Dec 31, 2010
Strong Resistence level at: 6274.30 - Set on Jan 04, 2008
Strong Resistence level at: 6312.45 - Set on Nov 05, 2010 (Double Top of Jan 04, 2008)
Next Support Levels:
Minor support level at 5182.93 set by 200 days EMA
Minor support level at 4965.92 set by 50 days EMA
Strong support level at 4718.00 set on Feb 05, 2010
Strong support level at 4639.10 set on Nov 24, 2011
Minor Support level at 4531.15 set on Dec 20, 2011
Strong support level at 4003.90 set on Jul 10, 2009
Strong support level at 2620.10 set on Mar 06, 2009 Will reach here with double dip
Strong support level at 2584.00 set on Oct 24, 2008 Will reach here with double dip
Posted on Feb 04, 2012
|
|