Nifty Weekly Forecast From Dec 10, 2012 - Expect Nifty for sudden debacle! (Expected Trading Range: 5355 - 6000)
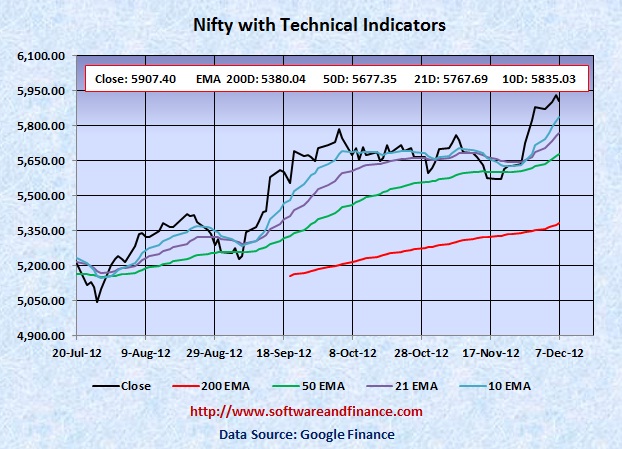
Dec 07, 2012 - Nifty closed today at 5907.40.00 which is about 28 points up from the last week close of 5879.00 on Nov 30, 2012. Nifty was trading between 5838.90 and 5949.85 that is the swing of about 111 points.
To watch Nifty Index in google finance, visit the following link:
NSE Index in Google Finance
To watch Nifty Index in yahoo finance, visit the following link:
NSE Index in Yahoo Finance
Last Week Analysis - Market was in Bullist Breakout
Nifty continued its bullish break out and eventually it is getting ready for free fall. Historically we have seen that before market correction, market will make an vertical move up in order to create confusion. By looking at the chart below, we can clearly see that vertical upward move is in place. We can expect nifty to collapse any time soon once FII (Foreign Institutional Investor) pulls out of money from Indian Equties market.
US Stock Market Indices stayed flat during this week. Unemployment report edged down to 7.7% which is reasonably a good number compared to earlier this year. It shows there is a sign of improvement in the labour market. But Fiscal Cliff and the upcoming interest rate hike might stall the empoyment growth. It is quite natural since the market has gone up so much from May 2009, it has to go down before it moves up again.
After the November monthly employment report released on Friday, US treasuries lead its sell off since the long waited fear of increasing the Fed Interest Rate might happen as early as mid of next year. TLT closed today at 124.43 compared to the last week close of 124.79. TLT reached its all time high point of 132.21 on July 25, 2012. Until the fiscal cliff is cleared, that can happen only by end of this month, TLT will have to stay in the range bound. Any positive news for tax payers can lead to major sell off in US treasuries. It is safe to get out of US Treasuries, if you are on the profit side. Not the downside looks huge compared to upside.
Last Week Low: 5838.90
Last Week High: 5949.85
Not Safe to hold your long positions on Nifty
Nifty made a bullish break out on technicals which often can lead to sudden debacle. It is to eliminate the amateur short seller to cover their position and so that big players can take advantages of the huge gain.
Nifty trading 500 points above its 200 days EMA, is considered as an best exit point for your long position on equities. It may continue its bull run but it does not promise anything. If you are conservative investors, hold currency or indian T-Bills. You can take long positions on Nifty between 4000 and 4500.
Nifty might experience a double dip in Indian Market along with world market correction in the long term (about one and half years). With double dip, Nifty is expected to touch 2600 levels set on Oct 2008 and Mar 2009. Wait for some more time to get more clues on "double dip on Nifty"
For Speculators and Intraday Players - Bet On Volatility
CBOE Volatility Index (VIX) closed today at 15.90 which is almost flat compared to the last week close of over 15.87. Now the market is not showing any fear compared to post election, but still VIX is going to make a powerful upmove Now everyone is watching on Fiscal Cliff that can contribute a significant move on bond and equities market. Until this is cleared by congress end of this year, market will trade in range bound.
Only if you are day trader, you can have the following options:
1. Buy 1X OTM call option and 2X OTM put option - Long Strip.
2. Long Stocks and stop loss orders
3. Long Stocks with long put options
Note: OTM - means Outside the money.
Technical Indicators
Next Resistance Levels:
Strong Resistence level at: 6312.45 on Nov 05, 2010
Psychological Resistence Level at: 6000.00
Strong Resistence level at: 5360.70 - Set on Oct 28, 2011
Strong Resistence level at: 5633.95 - Set on Jul 22, 2011
Strong Resistence level at: 5884.70 - Set on Apr 28, 2011
Strong Resistence level at: 6134.50 - Set on Dec 31, 2010
Strong Resistence level at: 6274.30 - Set on Jan 04, 2008
Strong Resistence level at: 6312.45 - Set on Nov 05, 2010 (Double Top of Jan 04, 2008)
Next Support Levels:
Strong Support level at: 5677.35 Set by 50 days EMA
Strong Support level at: 5380.04 Set by 200 days EMA
Psychological Support Level at: 5000.00
Strong support level at 4835.65 set on May 23, 2012
Strong support level at 4718.00 set on Feb 05, 2010
Strong support level at 4639.10 set on Nov 24, 2011
Minor Support level at 4531.15 set on Dec 20, 2011
Strong support level at 4003.90 set on Jul 10, 2009
Strong support level at 2620.10 set on Mar 06, 2009 Will reach here with double dip
Strong support level at 2584.00 set on Oct 24, 2008 Will reach here with double dip
Posted on Dec 08, 2012
|
|