Nifty Weekly Forecast From April 16, 2012 - Nifty Trading below its 200 days EMA! (Expected Trading Range: 4995 - 5254)
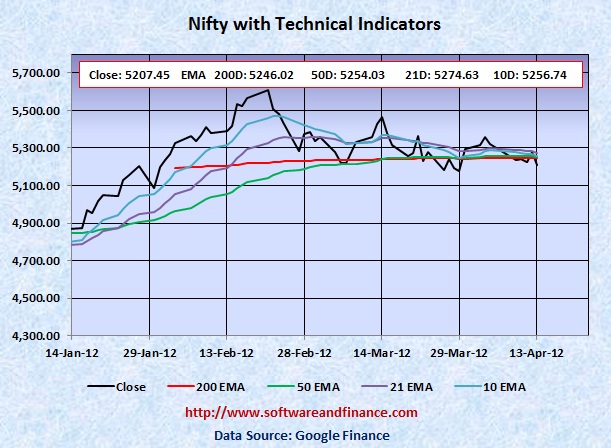
Apr 13, 2012 - Nifty closed today at 5207.45 which is about 115 points down (2.17%) from the last week close of 5322.90 on Apr 04, 2012. Nifty was trading between 5185.40 add 5306.75 that is the swing of 121.35 points. Note that Nifty was up by about 12.61% year to date in 2012.
To watch Nifty Index in google finance, visit the following link:
NSE Index in Google Finance
To watch Nifty Index in yahoo finance, visit the following link:
NSE Index in Yahoo Finance
Last Week Analysis - Nifty went below its 200 days EMA
Nifty was down 2.17% for the last week and still it was up by 12.61% for year to date. If you see the chart below, Nifty went below its 200 days EMA couple of in the last 4 weeks and regained its support level. Every time it is hitting lower low signals that it is going bring up a big down move shortly. Currently emerging markets are leading the developed countries.
Interest rate has started moving down signals the some investors are getting panic. I have been mentioning in the past weeks that greedy investors will not hesitate to stop betting until Nasdaq reaches 3,000.00, Dow Jones reaches 13,000.00 and S&P 500 reaches 1,400.00 in the last couple of weeks. It is nothing but to touch the fancy number before it moves down significantly and this is the time when the Nasdaq Tech bubble will burst. Currently all indicies have crossed the upper bound.
Oil prices have been gone up so fast in the last 6 months. During election year, oil prices will be trading at low levels historically due to polictial interest. Besides rising dollar is the key factor now. Market bottom will be seen around election that is where when everything goes down except US$.
FYI - France will hold presidential elections on April 22 and May 6, followed by general elections in June.
US will hold presidential elections on Nov 06, 2012.
With respect to US long term treasury prices, TLT closed today at 116.84 which is US$3.93 up for the week compared to last week close of 112.91. US treasury is bit late to good buy now since it bounced a lot this week. But if you are short on US treasuries, you have to liquidate your short position. US treasuries (Ticker: TLT) TLT upside is huge now that is towards 125-130.
Last Week Low: 5185.40
Last Week High: 5306.75
It is time to liquidate all of your long positions on Nifty and create new short position. We do not have any history of running into bull market crossing over 200 days EMA in one shot. It has to go through a couple of retesting. Still market has to go through lots of bad news from Euro Zone, downgrades, unemployment, etc.
If you are conservative investors, hold currency or indian T-Bills rather than creating short position on Nifty. You can take long positions on Nifty between 4000 and 4500.
Nifty might experience a double dip in Indian Market along with world market correction in the long term (about one and half years). With double dip, Nifty is expected to touch 2600 levels set on Oct 2008 and Mar 2009. Wait for some more time to get more clues on "double dip on Nifty"
For Speculators and Intraday Players - Options Strip
1. Buy 2X OTM put option and 1X OTM call option - Options Strip.
2. Short Stocks and stop loss orders.
3. Short Stocks with long call options
Note: OTM - means Outside the money.
Technical Indicators
10 days EMA: 5256.74
21 days EMA: 5274.63
50 days EMA: 5254.03
200 days EMA: 5246.02
Next Resistance Levels:
Strong Resistence level at: 5360.70 - Set on Oct 28, 2011
Strong Resistence level at: 5633.95 - Set on Jul 22, 2011
Strong Resistence level at: 5884.70 - Set on Apr 28, 2011
Strong Resistence level at: 6134.50 - Set on Dec 31, 2010
Strong Resistence level at: 6274.30 - Set on Jan 04, 2008
Strong Resistence level at: 6312.45 - Set on Nov 05, 2010 (Double Top of Jan 04, 2008)
Next Support Levels:
Minor support level at 5246.02 set by 200 days EMA
Minor support level at 5254.03 set by 50 days EMA
Strong support level at 4718.00 set on Feb 05, 2010
Strong support level at 4639.10 set on Nov 24, 2011
Minor Support level at 4531.15 set on Dec 20, 2011
Strong support level at 4003.90 set on Jul 10, 2009
Strong support level at 2620.10 set on Mar 06, 2009 Will reach here with double dip
Strong support level at 2584.00 set on Oct 24, 2008 Will reach here with double dip
Posted on Apr 14, 2012
|
|