Nifty Weekly Forecast From Jan 23, 2012 - Get ready for free fall..! (Expected Trading Range: 4544 - 5100)
Jan 20, 2012 - Nifty closed today at 5048.60 which is about 183 points up (3.75%) from the last week close of 4866.00 on Jan 13, 2012. Nifty was trading between 4,827.05 and 5064.15 which is about the swing of 237 points.
To watch Nifty Index in google finance, visit the following link:
NSE Index in Google Finance
To watch Nifty Index in yahoo finance, visit the following link:
NSE Index in Yahoo Finance
Last Week Analysis - Speculators Screaming that Bull Market is Back
Nifty was up by 3.75% for the last week and was up by 9.18% for year to date.
FYI - France will hold presidential elections on April 22 and May 6, followed by general elections in June.
US will hold presidential elections on Nov 06, 2012.
Some investors strongly belive that Nifty short term correction is coming to end and took long positions. It pushed the market higher. Last week speculators claiming that bull market is back and they keep followed the buying pattern. Now is another chance to liquidate your long positions and go short on Nifty. Go long on Indian T-Bills and INR.
With respect to US long term treasury prices, TLT closed today at 116.98 which a loss of 2.23% for the week compared to last week close of 120.88. US treasury is now too late to short and too early to buy. US treasuries (Ticker: TLT) would bottom near 100 - 103 and TLT upside would be maximum of 125-130.
Last Week Low: 4,827.05
Last Week High: 5,064.15
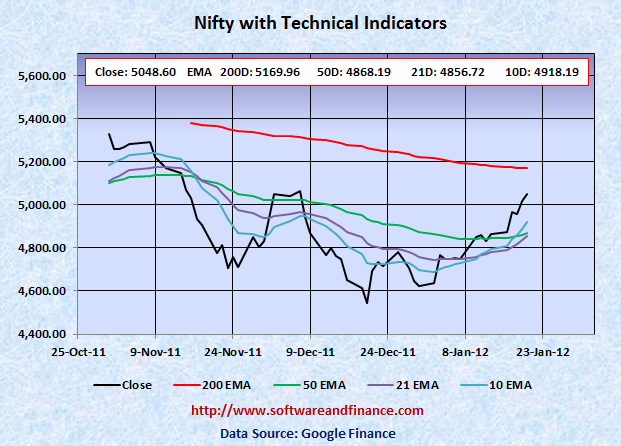
Nifty technical levels clearly suggest that hedge or liquidate your long positions now. Because The next resistance level for Nifty is 5100 and 5169.
Note: Now you start shorting Nifty on the long term as it is very much unlikely it will go higher than its 200 days EMA. This is the time when there is limited upside and huge downside on nifty.
If you are conservative investors, hold currency or indian T-Bills. You can take long positions on Nifty between 4000 and 4500.
Nifty might experience a double dip in Indian Market along with world market correction in the long term (about one and half years). With double dip, Nifty is expected to touch 2600 levels set on Oct 2008 and Mar 2009. Wait for some more time to get more clues on "double dip on Nifty"
For Speculators and Intraday Players - Options Strip
1. Buy 2X OTM put option and 1X OTM call option - Options Strip.
2. Short Stocks and stop loss orders.
3. Short Stocks with long call options
Note: OTM - means Outside the money.
Technical Indicators
10 days EMA: 4918.19
21 days EMA: 4856.72
50 days EMA: 4868.19
200 days EMA: 5169.96
Next Resistance Levels:
Strong Resistence level at: 5169.96 - 200 days EMA
Next Support Levels:
Minor support level at 4868.19 set by 50 days EMA
Strong support level at 4718.00 set on Feb 05, 2010
Strong support level at 4639.10 set on Nov 24, 2011
Minor Support level at 4531.15 set on Dec 20, 2011
Strong support level at 4003.90 set on Jul 10, 2009
Strong support level at 2620.10 set on Mar 06, 2009 Will reach here with double dip
Strong support level at 2584.00 set on Oct 24, 2008 Will reach here with double dip
Posted on Jan 21, 2012
|
|