Nifty Weekly Forecast From Dec 12, 2011 - Nifty to enter range bound trading (Expected Trading Range: 4600 - 5015)
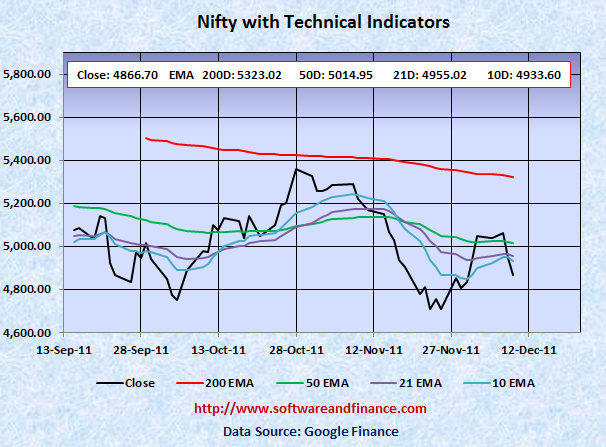
Dec 09, 2011 - Nifty closed today at 4866.70 which is about 183 points from (3.72%) from the last week close of 5050.15 on Dec 02, 2011. Nifty was trading between 4841.75 and 5099.25 which is about the swing of 258 points.
As I mentioned in the last week forecast - trading range of 4600 - 5100 became very accurate as the last week high was 5099.25.
To watch Nifty Index in google finance, visit the following link:
NSE Index in Google Finance
To watch Nifty Index in yahoo finance, visit the following link:
NSE Index in Yahoo Finance
Last Week Analysis - Selling continued with Euro Zone volatility
Nifty was down by 3.72% in the last week. Selling pressure and volatilty is related with Euro zone news.
Go long on Indian T-Bills and INR. With respect to US long term treasury prices, TLT closed today at 116.73 which a loss of 1.63% for the week compared to last week close of 118.67. US treasury is too early to buy and too late to short. US treasuries (Ticker: TLT) would bottom near 100 - 103 and TLT is a good short position if it moves above 125.
Note: US Interest Rate Bottom retesting will happen again in the coming months.
Last Week Low: 4841.75
Last Week High: 5099.25
Nifty technical levels clearly suggest that hold and/or liquidate your short positions now. Because Nifty has got strong resistance level of 5050 and 5100. US treasuries went down significantly leaving the room to have another rally suggests that market will go down further with high volatility.
Note: Nifty is very risky to go long, eventhough it may have a false attempt to retest its 200 days EMA of 5334. Last week I asked to take short positions gradually with a ladder of orders. This week you can hold or liquidate short positions based on your risk rolerance. The next downside target for Nifty below 4500 and 4000. We may not reach this point directly. There might be many bear market rally and wild swings on the way.
If you are conservative investors, then exit from your long positions now and hold currency or indian T-Bills. The key support level for Nifty is 4747, 4639 and 4000. The key resistance level is 5400.0 and 5050, which is very much unlikely we will reach and go beyond this level.
Nifty might experience a double dip in Indian Market along with world market correction in the long term (about 2 years). With double dip, Nifty is expected to touch 2600 levels set on Oct 2008 and Mar 2009. Wait for some more time to get more clues on "double dip on Nifty"
For Speculators and Intraday Players - Short Stocks with Stop Loss Orders and Long Options Strip
1. Buy 2X OTM put option and 1X OTM call option.
2. Short Stocks and stop loss orders.
3. Short Stocks with long call options
Note: OTM - means Outside the money.
Technical Indicators
10 days EMA: 4933.69
21 days EMA: 4955.02
50 days EMA: 5014.95
200 days EMA: 5323.03
Next Resistance Levels:
Strong Resistence level at: 5323.03 - 200 days EMA
Strong Resistence level at: 5014.95 - 50 days EMA
Next Support Levels:
Strong support level at 4940.95 set on Sep 13, 2011
Strong support level at 4806.75 set on May 25, 2010
Strong support level at 4747.80 set on Aug 26, 2011
Strong support level at 4718.00 set on Feb 05, 2010
Minor support level at 4639.10 set on Nov 24, 2011
Strong support level at 4003.90 set on Jul 10, 2009
Strong support level at 2620.10 set on Mar 06, 2009 Will reach here with double dip
Strong support level at 2584.00 set on Oct 24, 2008 Will reach here with double dip
Posted on Dec 11, 2011
|
|