Nifty Weekly Forecast From Nov 28, 2011 - Time to go long to enjoy Bear Market Rally (Expected Trading Range: 4546 - 5049)
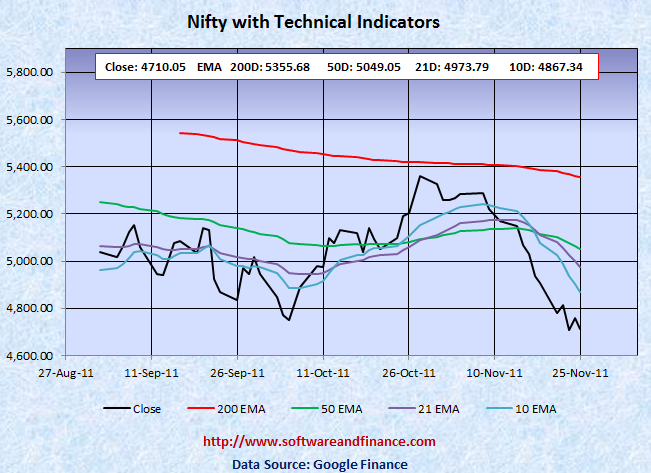
Nov 25, 2011 - Nifty Closed today at 4,710.05 which is about 195 points down (3.99%) from the last week close of 4,905.80 on Nov 18, 2011. Nifty was trading in between 4873.80 and 4639.10 which is about the swing of 234 points.
Notice that in the last two weeks (10 trading sessions), Nifty was down by 458 points which 8.88%. It is the time to expect a bear market rally, even market may seek the next support level of 4000 set on Jul 10, 2009.
To watch Nifty Index in google finance, visit the following link:
NSE Index in Google Finance
To watch Nifty Index in yahoo finance, visit the following link:
NSE Index in Yahoo Finance
Last Week Analysis - Selling Continues...
Nifty went down by 3.99% last week. As per my last week forecast, Market started moving down and it did cross by expected support level of 4747 and closed at 4710. Go long on Indian T-Bills and INR. With respect to US long term treasury prices, TLT closed today at 120.79 with a small gain of 1.2% for the week. US treasury is too early to buy and too late to short. US treasuries (Ticker: TLT) would bottom near 100 - 103 and TLT is a good short position if it moves above 125.
Note: US Interest Rate Bottom retesting will happen again in the coming months.
Last Week Low: 4639.10
Last Week High: 4873.80
Nifty technical levels clearly suggest that cover your short positions now. Because Nifty has got strong support level 4800 and 4747. We have done a retesting of couple of times, it may even go down further. For the safer side, cover your short positions and wait for the next buying opportunity to participate in the bear market rally. US treasuries are flat eventhough market moved down significantly suggests the bear market really is imminent.
Note: Nifty is very risky to short at this time. Take long positions gradually with a ladder of orders. You can initiate long positions now. But if it goes down further, you should be in position to buy again. The next target for Nifty on the downside is 4000. We may not reach this point directly. There might be many bear market rally and wild swings on the way.
If you are conservative investors, then exit from your long positions whenever there is a rally and hold currency or indian T-Bills. The key support level for Nifty is 4747, 4639 and 4000. The key resistance level is 5400.0 and 5050, which is very much unlikely we will reach and go beyond this level.
Nifty might experience a double dip in Indian Market along with world market correction in the long term (about 2 years). With double dip, Nifty is expected to touch 2600 levels set on Oct 2008 and Mar 2009. Wait for some more time to get more clues on "double dip on Nifty"
For Speculators and Intraday Players - Long Stocks with Stop Loss Orders and Prepare for bear market rally
1. Cover your long dated (OTM) put option, if you have bought last week.
2. Long Stocks and stop loss orders.
Note: OTM - means Outside the money.
Technical Indicators
10 days EMA: 4867.34
21 days EMA: 4973.79
50 days EMA: 5049.05
200 days EMA: 5355.68
Next Resistance Levels:
Strong Resistence level at: 5355.68 - 200 days EMA
Strong Resistence level at: 5049.05 - 50 days EMA
Next Support Levels:
Strong support level at 4806.75 set on May 25, 2010
Strong support level at 4747.80 set on Aug 26, 2011
Strong support level at 4718.00 set on Feb 05, 2010
Minor support level at 4639.10 set on Nov 24, 2011
Strong support level at 4003.90 set on Jul 10, 2009
Strong support level at 2620.10 set on Mar 06, 2009 Will reach here with double dip
Strong support level at 2584.00 set on Oct 24, 2008 Will reach here with double dip
Posted on Nov 26, 2011
|
|