Nifty Weekly Forecast From Nov 21, 2011 - Cover Short Position and Plan for Bear Market Rally (Expected Trading Range: 4747 - 5115)
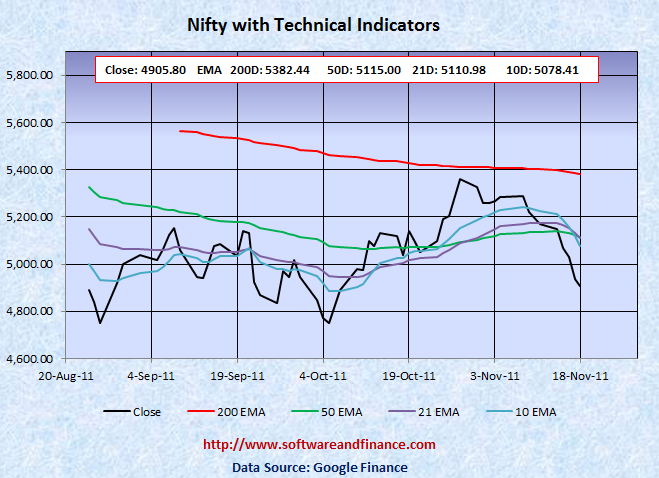
Nov 18, 2011 - Nifty Closed today at 4,905.80 which is about 263 points down (5.09%) from the last week close of 5168.85 on Nov 11, 2011. Nifty was trading in between 5,228.90 and 4,837.95 which is about the swing of 391 points.
To watch Nifty Index in google finance, visit the following link:
NSE Index in Google Finance
To watch Nifty Index in yahoo finance, visit the following link:
NSE Index in Yahoo Finance
Last Week Analysis - EU anxiety triggered selling pressure again
Nifty went down by 5.09% last week. As per my last week forecast, Market started moving down with EU anxiety triggered selling pressure again. Go long on Indian T-Bills and INR. With respect to US long term treasury prices, TLT closed today at 119.36 with a small gain of every trading session in this week. US treasury is too early to buy and too late to short. US treasuries (Ticker: TLT) would bottom near 100 - 103 and TLT is a good short position if it moves above 125.
Note: US Interest Rate Bottom retesting will happen again in the coming months.
Last Week Low: 5,228.90
Last Week High: 4,837.95
Nifty technical levels suggest that cover your short positions now. Because Nifty has got strong support level 4800 and 4747. We have done a retesting of couple of times, it may even go down further. For the safer side, cover your short positions and wait for the next buying opportunity to participate in the bear market rally.
If you are conservative investors, then exit from your long positions whenever there is a rally and hold currency or indian T-Bills. The key support level for Nifty is 5100, 4960, 4800 and 4747. The key resistance level is 5400.0, which is very much unlikely we will reach and go beyond this level.
Nifty might experience a double dip in Indian Market along with world market correction in the long term (about 2 years). With double dip, Nifty is expected to touch 2600 levels set on Oct 2008 and Mar 2009. Wait for some more time to get more clues on "double dip on Nifty"
For Speculators and Intraday Players - Bet on volatility and Prepare for bear market rally
1. Cover your long dated (OTM) put option, if you have bought last week.
2. Long 1 OTM call and OTM Put option - Betting on Volatility
Note: OTM - means Outside the money.
Technical Indicators
10 days EMA: 5078.41
21 days EMA: 5110.98
50 days EMA: 5115.00
200 days EMA: 5382.44
Next Resistance Levels:
Strong Resistence level at: 5382.44 - 200 days EMA
Strong Resistence level at: 5115.00 - 50 days EMA
Next Support Levels:
Minor support level at 4940.95 set on Sep 13, 2011
Strong support level at 4806.75 set on May 25, 2010
Strong support level at 4747.80 set on aUG 26, 2011
Strong support level at 4718.00 set on Feb 05, 2010
Strong support level at 4003.90 set on Jul 10, 2009
Strong support level at 2620.10 set on Mar 06, 2009 Will reach here with double dip
Strong support level at 2584.00 set on Oct 24, 2008 Will reach here with double dip
Posted on Nov 19, 2011
|
|