Nifty Weekly Forecast From Nov 07, 2011 - Hold / Accumulate your Short Position (Expected Trading Range: 4747 - 5405)
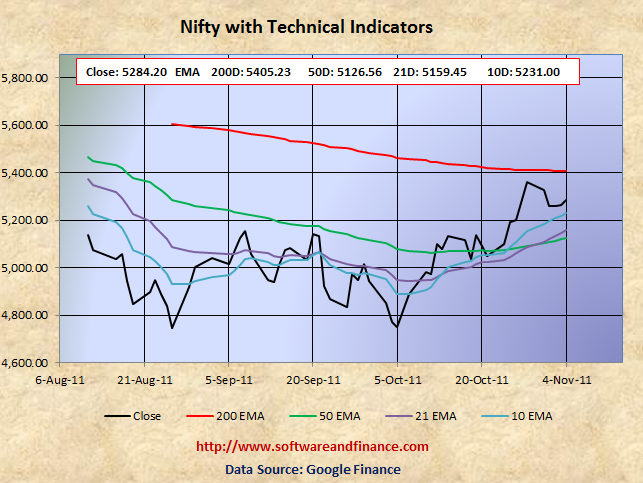
Nov 04, 2011 - Nifty Closed today at 5284.20 which is about 76 points down (1.43%) from the last week close of 5360.70 on Oct 28, 2011. Nifty was trading in between 5360.25 and 5201.85 which is about the swing of 158 points.
To watch Nifty Index in google finance, visit the following link:
NSE Index in Google Finance
To watch Nifty Index in yahoo finance, visit the following link:
NSE Index in Yahoo Finance
Last Week Analysis - EU anxiety triggered Selling and then relief rally
Nifty went down by 1.43% last week. As per my last week forecast, Market started moving down in the begining of the week with overbought condition and also EU anxiety triggered selling pressure again. In the later part of the week, market had a relief rally. It would be a another good time to liquidate your all long positions and create short positions on equities slowly. Go long on Indian T-Bills and INR. US 30 years treasury prices went up in the early week and currently it is looking for direction. US treasury is too early to buy and too late to short. US treasuries (Ticker: TLT) would bottom near 100 - 103. TLT closed today at 116.48.
Note: US Interest Rate Bottom retesting will happen again in the coming months.
Last Week Low: 5201.85
Last Week High: 5360.25
Nifty technical levels suggest clear betting on shorting the market now.
If you are conservative investors, then exit from your long positions with the recent rally and hold currency or indian T-Bills. The key support level for Nifty is 5100, 4960, 4800 and 4747. The key resistance level is 5405.0, which is very much unlikely we will reach and go beyond this level. Market is getting ready for imminent correction now.
Nifty might experience a double dip in Indian Market along with world market correction in the long term (about 2 years). With double dip, Nifty is expected to touch 2600 levels set on Oct 2008 and Mar 2009. Wait for some more time to get more clues on "double dip on Nifty"
For Speculators and Intraday Players - Short the Market with stop loss or long on long dated OTM Put options
1. Buy long dated (OTM) put option - at least one month expiry time.
2. Short the market with stop loss order
3. Short the market with long call option (Hedging)
Note: OTM - means Outside the money.
Technical Indicators
10 days EMA: 5231.00
21 days EMA: 5159.45
50 days EMA: 5126.56
200 days EMA: 5405.23
Next Resistance Levels:
Strong Resistence level at: 5405.23 - 200 days EMA
Next Support Levels:
Minor support level at 5126.56 set by 50 days EMA
Minor support level at 4940.95 set on Sep 13, 2011
Strong support level at 4806.75 set on May 25, 2010
Strong support level at 4747.80 set on aUG 26, 2011
Strong support level at 4718.00 set on Feb 05, 2010
Strong support level at 4003.90 set on Jul 10, 2009
Strong support level at 2620.10 set on Mar 06, 2009 Will reach here with double dip
Strong support level at 2584.00 set on Oct 24, 2008 Will reach here with double dip
Posted on Nov 06, 2011
|
|