Nifty Weekly Forecast From Oct 17, 2011 - Bear Market Rally will collapse (Expected Trading Range: 4747 - 5153)
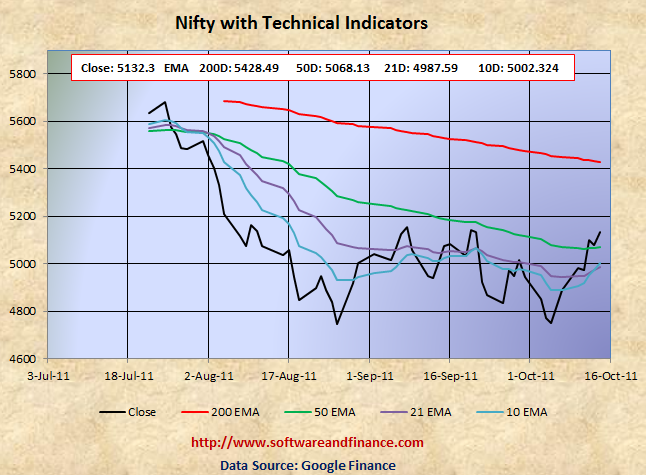
Oct 14, 2011 - Nifty Closed today at 5132.3 which is 244 points (5%) up from the last week close of 4888.05 on Oct 7, 2011. Nifty was trading in between 4,882.05 and 5,141.40 which is about the swing of 259 points.
To watch Nifty Index in google finance, visit the following link:
NSE Index in Google Finance
To watch Nifty Index in yahoo finance, visit the following link:
NSE Index in Yahoo Finance
Last Week Analysis - Bear Market Rally as US Long Term Interest Rate have Bottomed
Nifty had a very good week of 5% gain compared to last couple of weeks, it would be treated as a bear market rally and it is not a clear buy signal for conservative investors. As the 30 years yield of US treasuries bottomed, many investors started coming out of treasuries and they are not sure of what to do with the money. Consequently they have started invested again in US Stocks. This is the main cause of the last week rally in US Market. Indian markets and other Asian markets just followed US market trends. Note that US long term 30 years interest rate went up by 16.67% from 2.77% on Oct 04, 2011 to 3.22% on Oct 14, 2011. Again stocks are vulnerable of steep pullback.
Note: US Interest Rate Bottom retesting will happen again in the coming months.
Last Week Low: 4882.05 (Refer to the strong support level 4800, would be broken in the coming weeks)
Last Week High: 5141.40 (Strong resistance level build around 5100 range
Looking at the chart below clearly indicates the declining 200 days EMA and 50 days EMA. It means that market will tend to go lower in the long term with occasional bear market rally. In this market, buy and hold strategy would fail. We need to follow the key technical support levels and play with swing trading strategies. Swing trading involves high risks when range bound trading completely broken. Betting on volatility with negative bias would yield a lot in this market. Institutional investors are smartly exiting their long and short positions based on the market condition and keep switching their assets. When treasuries are reaching almost a top level, then institutional investors will exit from the treasuries and t-bills and switch back to undervalues banking and finance sector. This is the main cause of the rally in the last two trading sessions.
Nifty technical levels suggest betting on volatility as key support level to be broken in the coming weeks.
If you are conservative investors, then exit from your long positions with the recent rally and hold currency or indian T-Bills. The key resistance level for Nifty came down to 5100 and the key support level for Nifty is 4960, 4800 and 4747. The next key resistance level is 5225.90 and 5428.49, which is very much unlikely we will reach these level. Market is getting ready for imminent correction now.
Nifty might experience a double dip in Indian Market along with world market correction in the long term (about 2 years). With double dip, Nifty is expected to touch 2600 levels set on Oct 2008 and Mar 2009. Wait for some more time to get more clues on "double dip on Nifty"
For Speculators and Intraday Players - Betting on Volatility (Option Straddle / Strip)
1. Buy 1X times of (OTM) call options and 2X time of (OTM) put option - known as option strip.
2. Buy 1X time of call and 1X time of put option with the same strike price - known as option straddle.
Note: OTM - means Outside the money.
Technical Indicators
10 days EMA: 5002.32
21 days EMA: 4987.59
50 days EMA: 5068.13
200 days EMA: 5428.48
Next Resistance Levels:
Strong Resistence level at: 5153.25 - Set on Sep 09, 2011
Resistence level at: 5225.80 set on Feb 10, 2011 and Jun 20, 2011
Strong Resistence level at: 5428.49 - Set on Sep 09, 2011
Next Support Levels:
Minor support level at 5068.13 - 50 days EMA
Minor support level at 4940.95 set on Sep 13, 2011
Strong support level at 4806.75 set on May 25, 2010
Strong support level at 4747.80 set on aUG 26, 2011
Strong support level at 4718.00 set on Feb 05, 2010
Strong support level at 4003.90 set on Jul 10, 2009
Strong support level at 2620.10 set on Mar 06, 2009 Will reach here with double dip
Strong support level at 2584.00 set on Oct 24, 2008 Will reach here with double dip
Posted on Oct 15, 2011
|
|