Nifty Weekly Forecast Starting Sep 26, 2011 - Get Ready For Bear Market Rally (4747 - 5153)
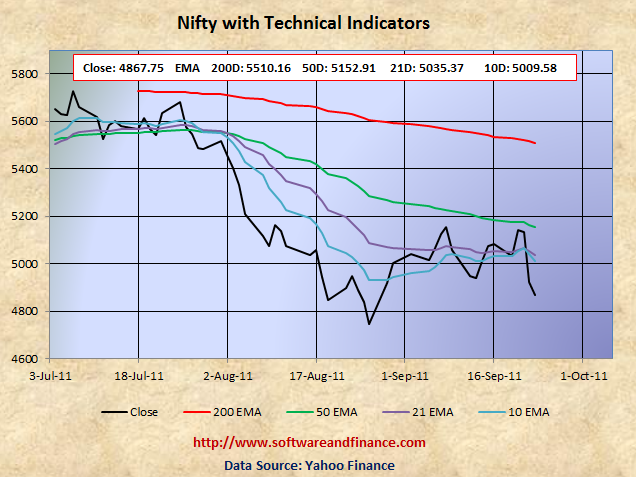
Sep 23, 2011 - Nifty Closed today at 4867.75 which is about 216 points down from the last week close of 5084.25 on Sep 16, 2011. Nifty lost 4.258% for this week. Besides Nifty experienced a huge swing for this week starting with a rally in the early week and followed by a huge sell off triggered by FOMC announcement on Wed Sep 21, 2011. Nifty was trading in between 4,829.60 and 5,168.40 which is about the swing of 339 points that is 6.5% from the top.
To watch Nifty Index in google finance, visit the following link:
NSE Index in Google Finance
To watch Nifty Index in yahoo finance, visit the following link:
NSE Index in Yahoo Finance
Last Week Analysis - US Fed Planning on operation twist and Euro Zone anxiety
Nifty started bouncing in the early week. But the announement from the Fed and Euro Zone anxiety triggered a huge sell of in Nifty also. What does Feb operation twist means? It will trigger short term rates to go up and long term rates to go down. Based on this, US dollar will get strengthen a lot. That is the reason of crash in gold and silver prices.
Last Week Low: 4829.60 (Refer to the strong support level 4800)
Last Week High: 5168.40
Nifty technical levels suggest taking long posistions with expectation of bear market really.
Long term investors can start taking long positions. If you are conservative and hold currency or indian T-Bills. Market may retest its support level 4747.00 before its powerful bear market rally this week. The key resistance level for Nifty is 5250 and the key support level for Nifty is 4960, 4800 and 4747.
Nifty might experience a double dip in Indian Market along with world market correction in the long term (about 2 years). With double dip, Nifty is expected to touch 2600 levels set on Oct 2008 and Mar 2009. Wait for some more time to get more clues on "double dip on Nifty"
For Speculators and Intraday Players - Bet on bear market rally (Option strap)
Market is getting ready for bear market rally.
1. Buy 2X times of (OTM) call options and 1X time of (OTM) put option - known as option strap.
2. Long stocks with stop loss orders or long put option - known as hedging
3. If you are on loss side of your long stocks, liquidate them With bear market rally
Note: OTM - means Outside the money.
Technical Indicators
10 days EMA: 5009.58
21 days EMA: 5035.37
50 days EMA: 5152.91
200 days EMA: 5510.16
Next Resistance Levels:
Minor Resistence level at: 5035.37 - 21 days EMA
Resistence level at: 5152.91 - 50 days EMA
Resistence level at: 5225.80 set on Feb 10, 2011 and Jun 20, 2011
Resistence level at: 5510.16 - 200 days EMA
Next Support Levels:
Minor support level at 4940.95 set on Sep 13, 2011
Strong support level at 4806.75 set on May 25, 2010
Strong support level at 4747.80 set on aUG 26, 2011
Strong support level at 4718.00 set on Feb 05, 2010
Strong support level at 4003.90 set on Jul 10, 2009
Strong support level at 2620.10 set on Mar 06, 2009 Will reach here with double dip
Strong support level at 2584.00 set on Oct 24, 2008 Will reach here with double dip
Posted on Sep 24, 2011
|
|