Nifty Weekly Forecast Starting Sep 19, 2011 - Market in range bound trading (4940 - 5183)
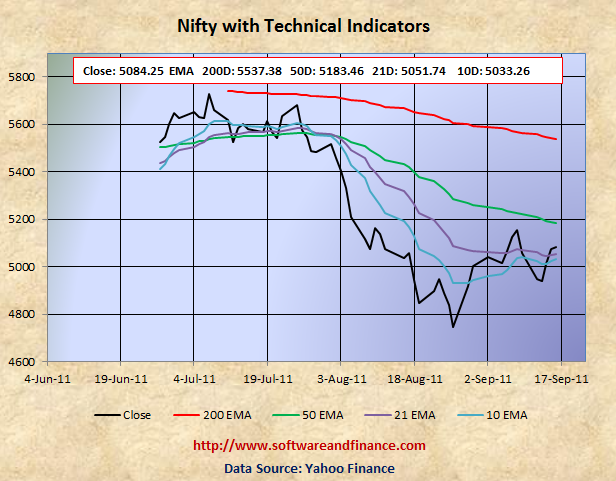
Sep 16, 2011 - Nifty Closed today at 5084.25 which is about 25 points up from the last week close of 5059.45 on Sep 09, 2011. Even though weekly gain is almost flat, Nifty experienced a huge sell off in the begining of the week and followed by short covering rally on in the late week. Nifty was trading in between 4,911.05 and 5,143.60 which is about the swing of 233 points.
To watch Nifty Index in google finance, visit the following link:
NSE Index in Google Finance
To watch Nifty Index in yahoo finance, visit the following link:
NSE Index in Yahoo Finance
Last Week Analysis - Euro Zone Fears and US short covering rally
Market continued last week sell off due to Euro Zone fear and follwed by short covering rally.
Last Week Low: 4911.05 (Refer to the strong support level 4800)
Last Week High: 5143.60
Nifty technical levels suggest to "hold/Liquidate" your existing long posistions.
Long term investors need to take break from taking long positions. If you are conservative and if you are on the profit side on your long position, you can liquidate a portion of your long positions and hold cuurency or indian T-Bills. Market will swing in either direction and look for direction this week. The key resistance level for Nifty is 5250 and the key support level for Nifty is 4960 and 4800.
Nifty might experience a double dip in Indian Market along with world market correction in the long term (about 2 years). With double dip, Nifty is expected to touch 2600 levels set on Oct 2008 and Mar 2009. Wait for some more time to get more clues on "double dip on Nifty"
For Speculators and Intraday Players - Bet on volatility (Option Strangle)
Market is ready for wild swing in either direction. Hedge your positions or use stop loss order.
1. Buy 1X times of (OTM) put options and 1X time of (OTM) call option - known as option strangle.
Note: OTM - means Outside the money.
Technical Indicators
10 days EMA: 5033.26
21 days EMA: 5051.75
50 days EMA: 5183.46
200 days EMA: 5537.38
Next Resistance Levels:
Resistence level at: 5183.46 - 50 days EMA
Resistence level at: 5225.80 set on Feb 10, 2011 and Jun 20, 2011
Resistence level at: 5537.38 - 200 days EMA
Next Support Levels:
Minor support level at 5051.75 set by 21 days EMA
Minor support level at 4940.95 set on Sep 13, 2011
Strong support level at 4806.75 set on May 25, 2010
Strong support level at 4718.00 set on Feb 05, 2010
Strong support level at 4003.90 set on Jul 10, 2009
Strong support level at 2620.10 set on Mar 06, 2009 Will reach here with double dip
Strong support level at 2584.00 set on Oct 24, 2008 Will reach here with double dip
Posted on Sep 18, 2011
|
|